AOI_RS_v85_en.pdf - 第148页
Chap ter3 SPC User Ma nual AOI Repair Station 144 3. The success message 4. Review the Excel file Display the m onitorin g condition for the c omponent, conte nts are: Machine means the type o f machine, 7006, 7100 or …
Chapter3 SPC User Manual
AOI Repair Station
143
7.4.4
Post Monitoring
After you stop monitoring, you can export the results of the current
“real-time monitor items” as an Excel sheet as shown below.
Style 1 Report
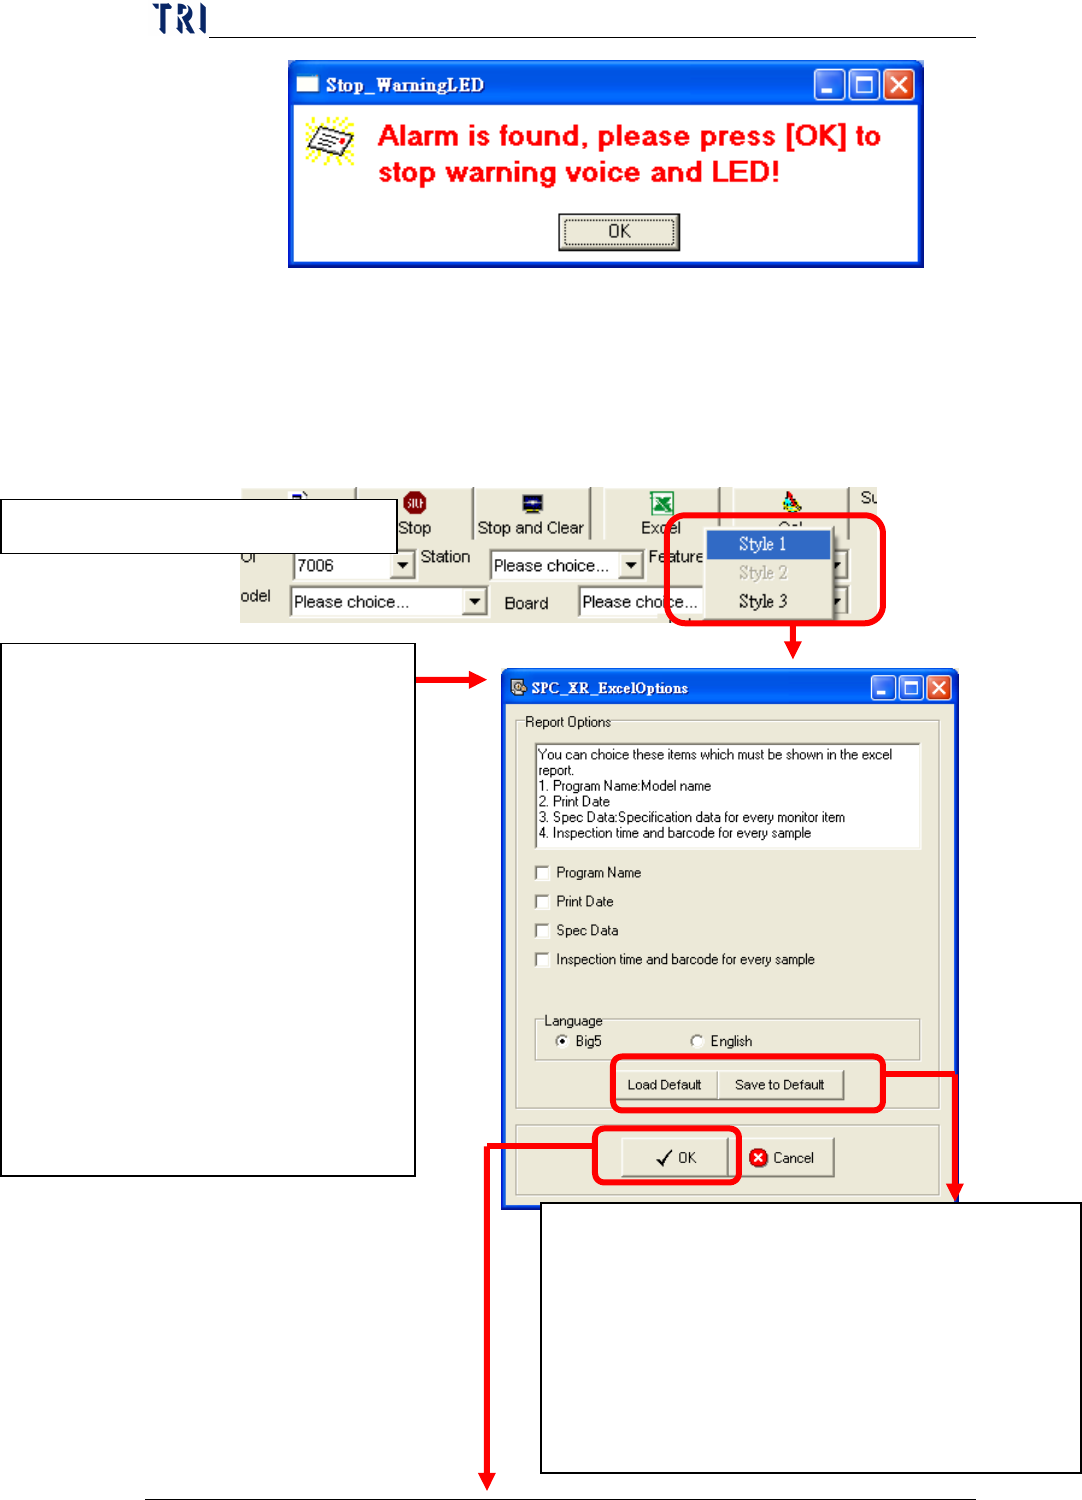
1. Click on [Excel] and Select Style 1
2. Report Parameters Setting
Select the data that user wants to output
besides statistic data and control chart
in Excel file. User can select:
Program Name
Print Date
Spec Data
Inspection time and barcode for
every sample: the inspection time
and barcode for the board that
every sample belongs to.
Language: The language of the
report; Big5 means Chinese and
English means English.
Save to Default: Save the settings to default.
Then system will use these settings next time.
Load Default: Load the last saved settings.
P.S. System will load the last saved settings
automatically when this window starts. And [Load
Default] is to cancel the current and load the default
setting again.
Chapter3 SPC User Manual
AOI Repair Station
144
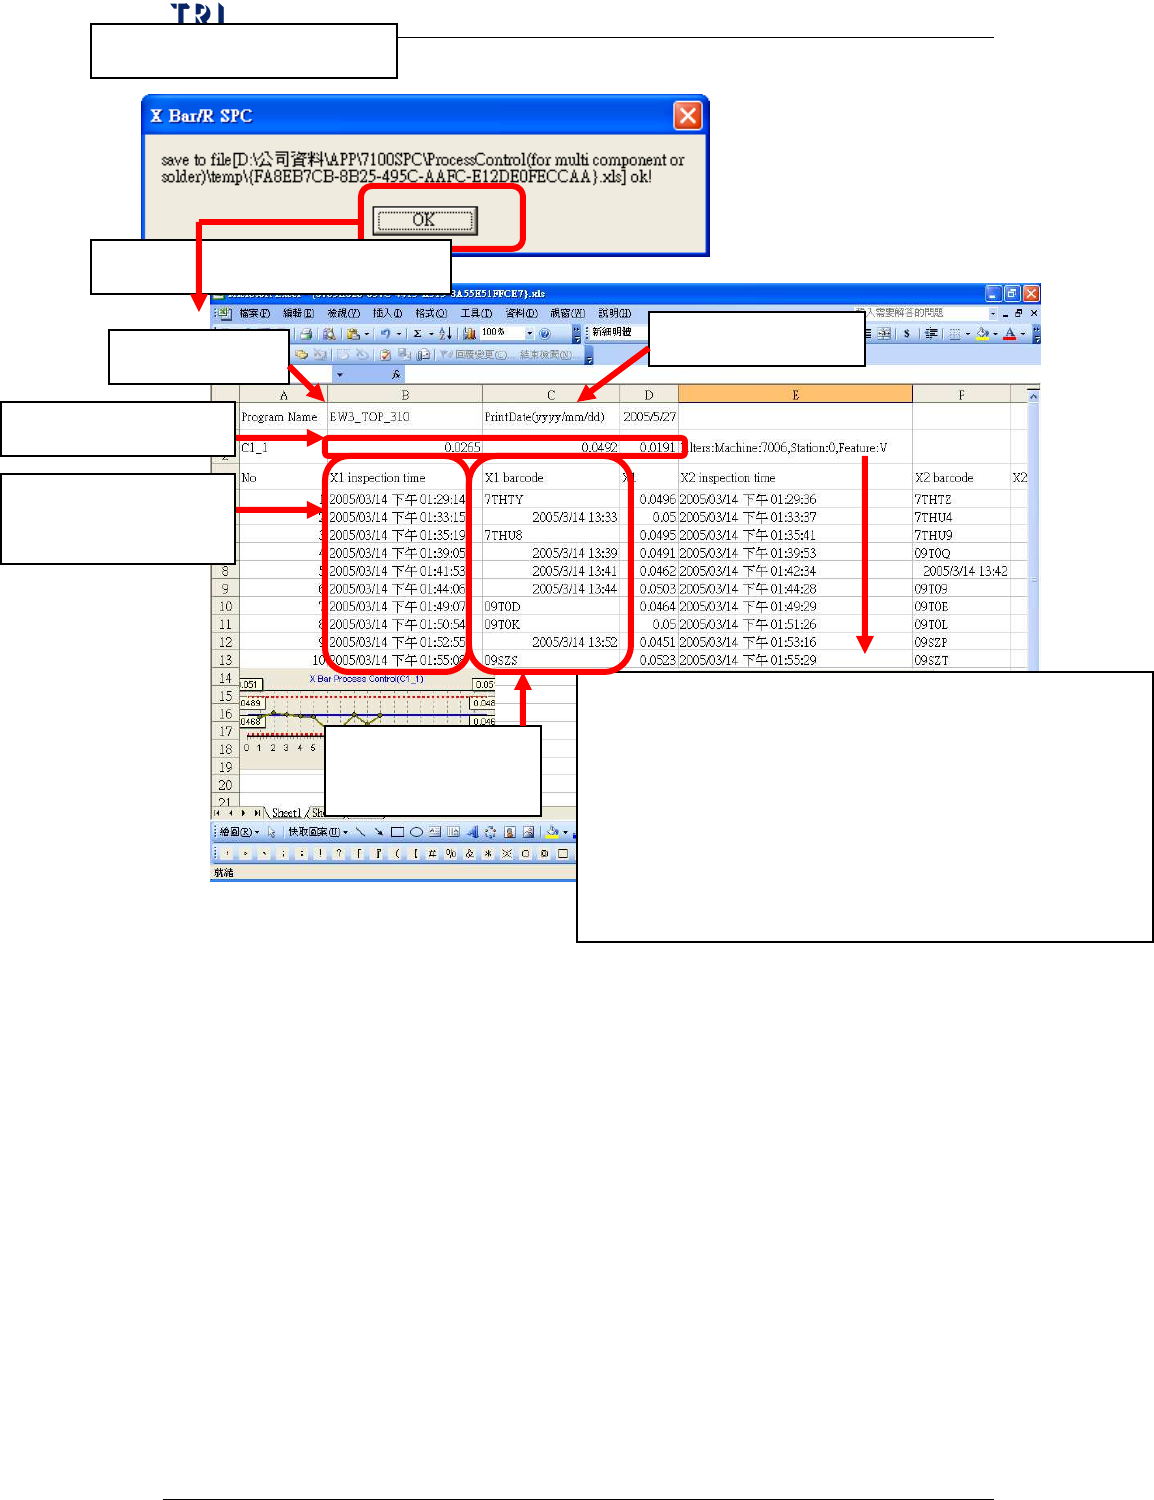
3. The success message
4. Review the Excel file
Display the monitoring condition for the component, contents are:
Machine means the type of machine, 7006, 7100 or ICT.
Station means the Machine ID
Feature means the selected feature, it may be V (Volume), A
(Area), H (Height), PX (X shift) or PY (Y shift) for 7006
(SPI); it may be X (X shift), Y (Y shift) or Theta (rotating
angle) for 7100 (AOI) and may be Measure for ICT.
Program Name
Print Date
Barcode for every
sample
Spec Data for C1_1
Inspection time for
every sample
Chapter3 SPC User Manual
AOI Repair Station
145
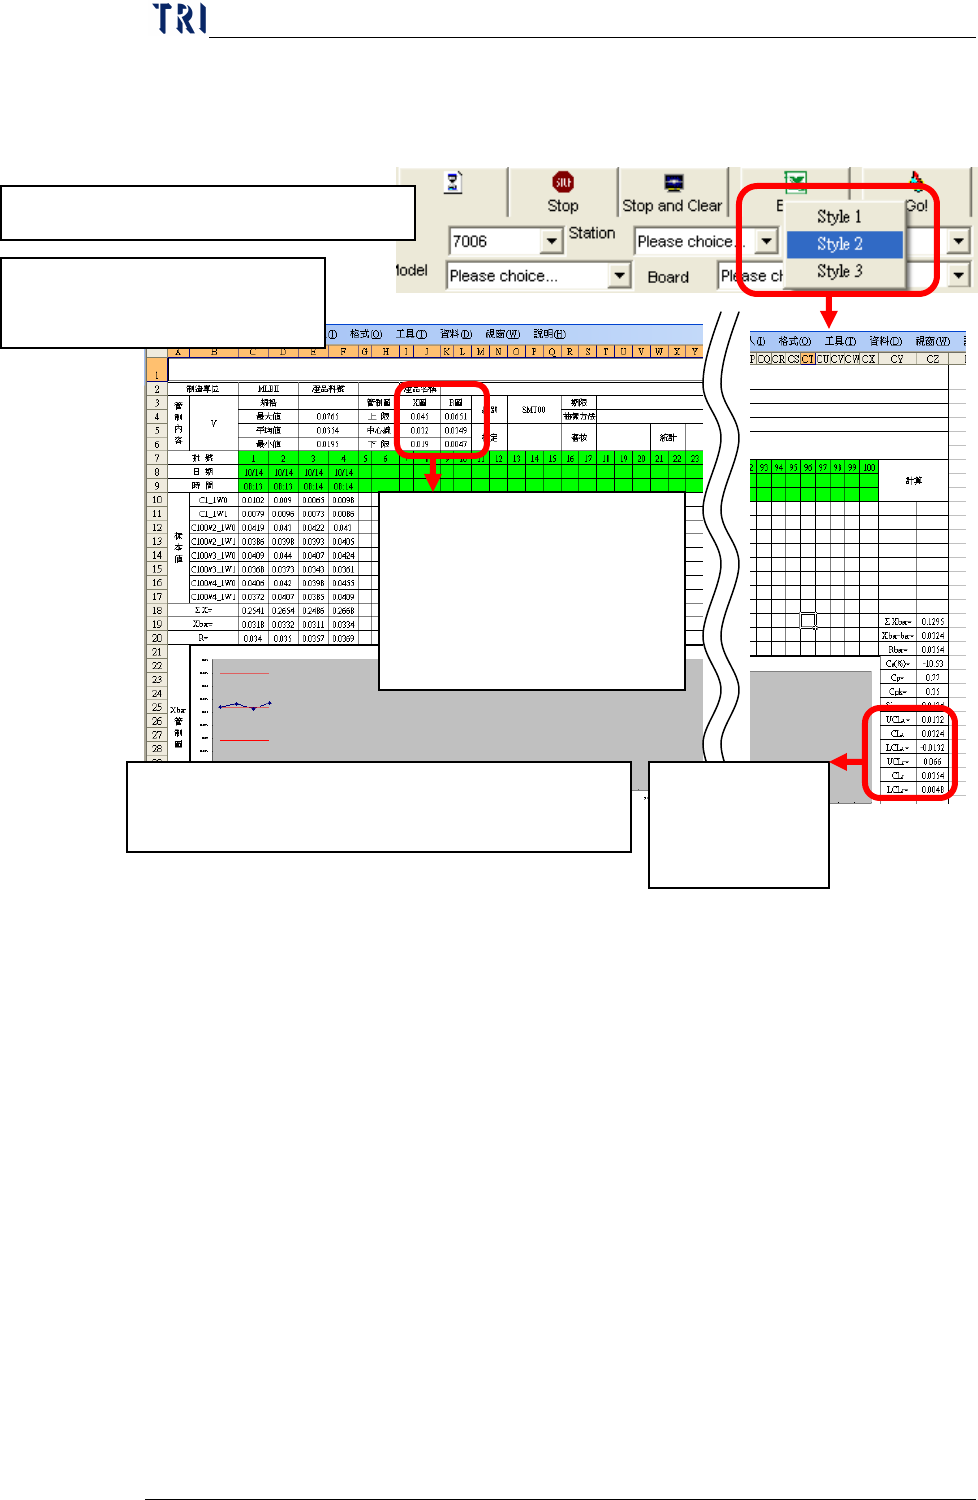
Style 2 Report: This kind report is only for [Mode2] under
[Group Mode].
1. Click on Excel and select Style 2
2. Review Excel file: A Sheet
only displays data for a group.
The control limits last week. If
this is data first week, for X bar
Chart we use the Spec Data and
for R Chart we use 0 to be the
control limits.
The control limits
this week up to
present.
P.S. If you change a sample data in this report, the relating
statistic data and control chart will be changed.