YesAX V3.1.2 - Software User Manual.pdf - 第177页
Other X-Ray Inspection Features 12 - 11 Upon entry, the cursor changes to a crosshair and the L ine Profile dialog box displ ays without a plot. Use the mouse to define the two end points of the line. First, press the le…
12-10 Other X-Ray Inspection Features
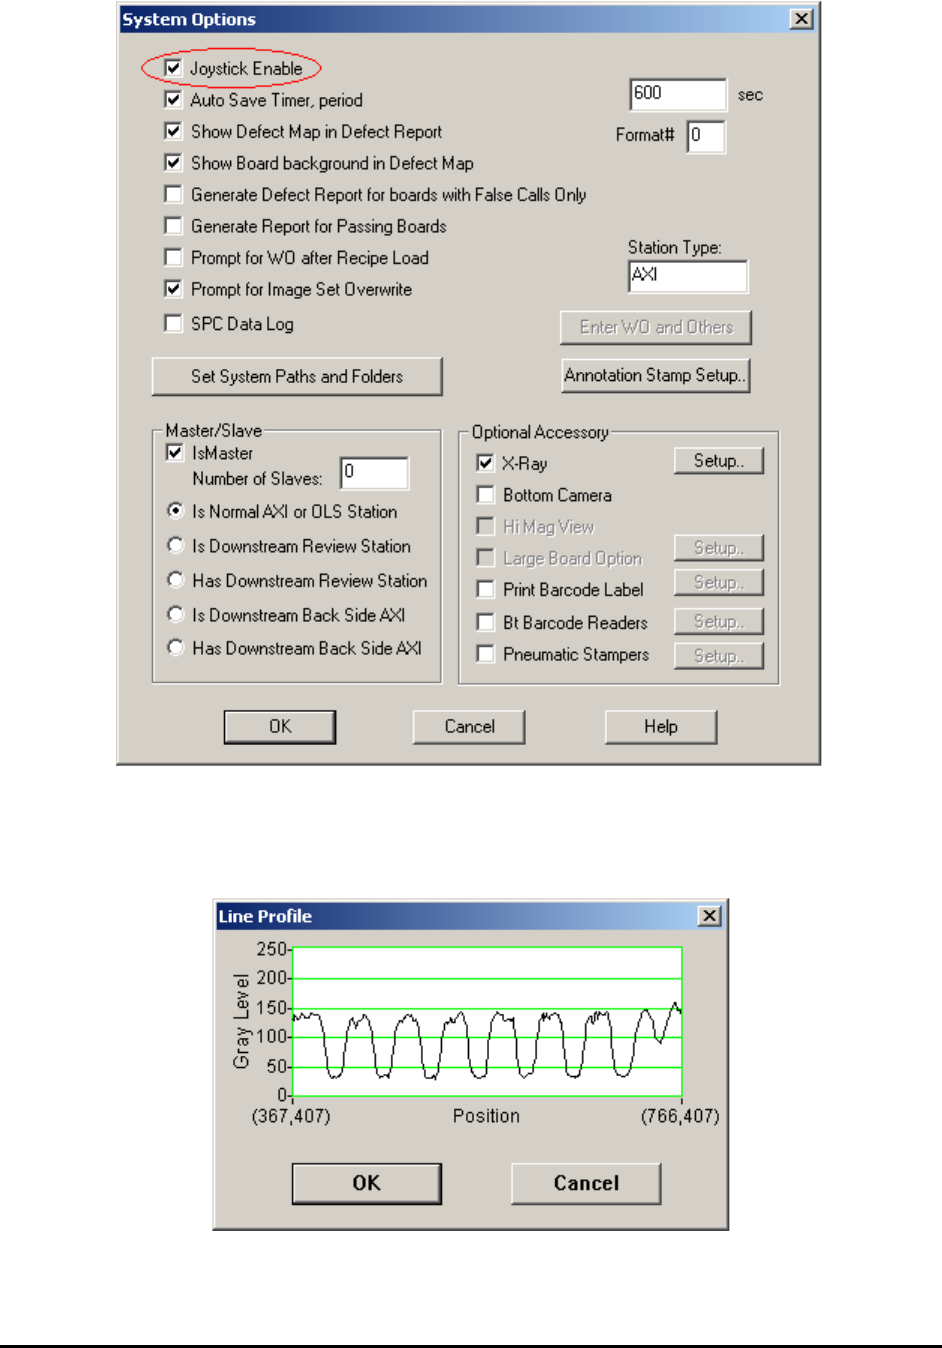
12.5 Line Profile
The Line Profile function provides a plot of the gray levels of the image pixels along a user
selected line. This function is only available for X-ray images.

Other X-Ray Inspection Features 12-11
Upon entry, the cursor changes to a crosshair and the Line Profile dialog box displays without a
plot. Use the mouse to define the two end points of the line. First, press the left mouse button to
define the starting point and move the mouse around. Locate the cursor on the end point and
release the left mouse button to complete the process. As the line is being defined, its current
profile plot appears in the Profile dialog box.
The profile graph represents the gray scale of each pixel overlaid by the graphic line. The
vertical axis of the graph displays the possible gray level range from 0(black) to 255 (white). The
horizontal axis represents the relative position of the pixel on the line. Each end of the horizontal
axis is labeled with the position of one end point of the line.
When the measurement task is completed, press OK or Cancel in the Line Profile dialog box to
close the box.