00197787-02_SI_SIPLACE_HeadVerification_EN.pdf - 第43页
6 Description of the test results 6.4 Anti-glare shield mounting Software Manual SIPLACE Head Verification 03/2018 43 6.4.3 Interpretation of the results obtained ‘Mounting variation’ error for all segments Cause Solutio…
6 Description of the test results
6.4 Anti-glare shield mounting
42 Software Manual SIPLACE Head Verification 03/2018
6.4 Anti-glare shield mounting
6.4.1 Measurement principle
The anti-glare shields are a key part of the C&P20A head, required to trigger the Z-axis bottom
light barrier. The measurement checks the correct mounting and the condition of the anti-glare
shields.
During the measurement, all segments are rotated in increments of 90° while, at the same time, the
Z-axis bottom light barrier voltage is measured. If an anti-glare shield is not mounted properly,
damaged or polluted, the voltage signal will drop immediately.
6.4.2 Measurement result
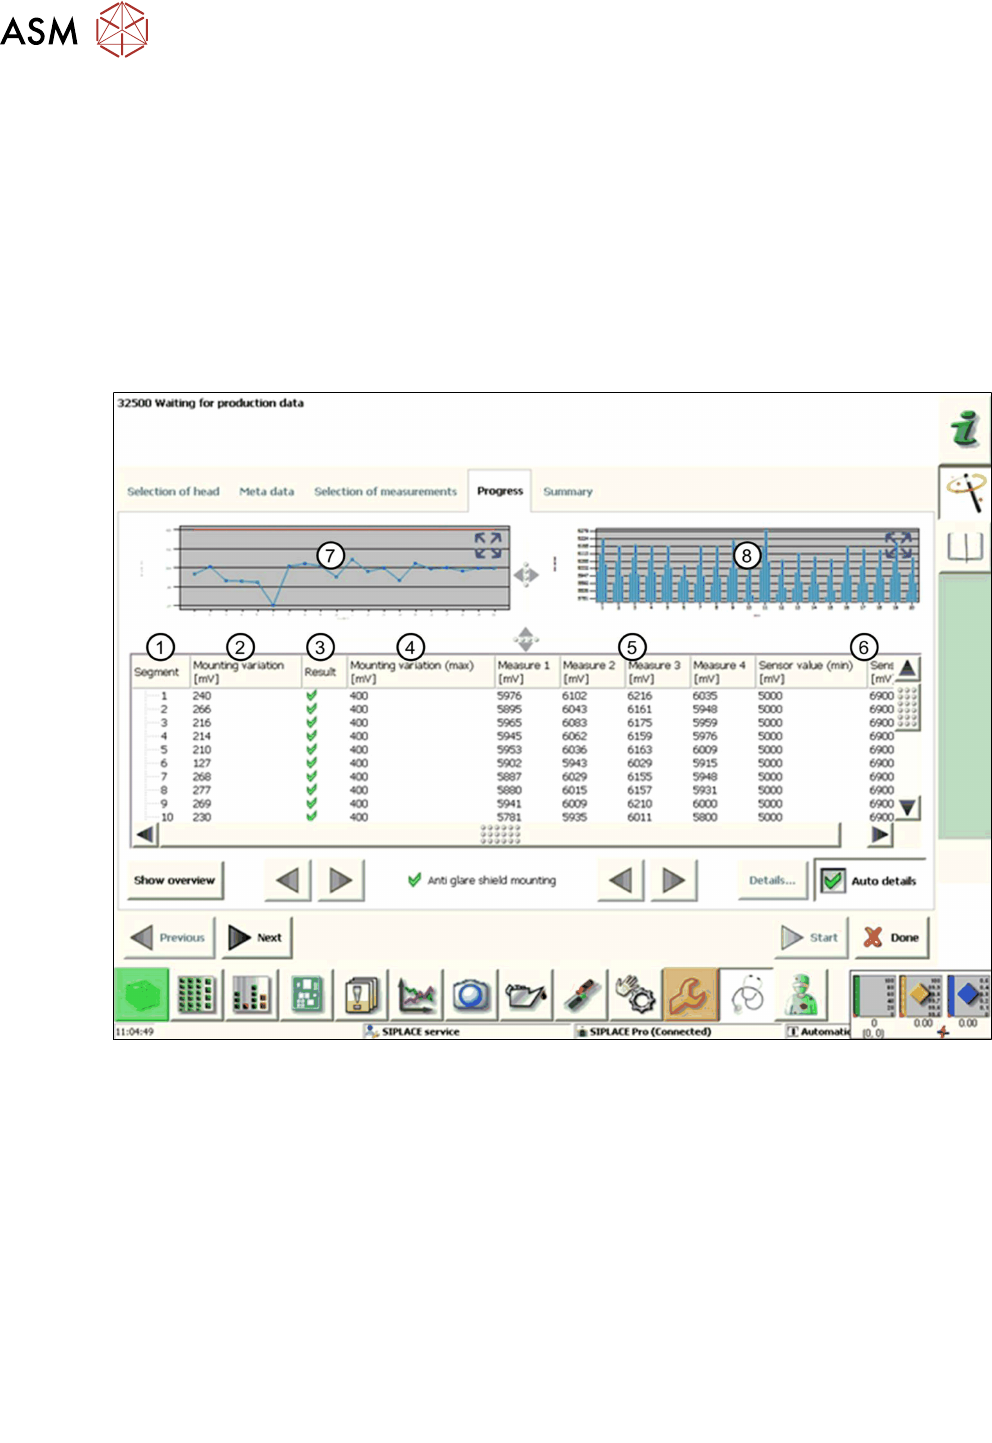
Fig.36: Result view – Anti-glare shield mounting
1 Measured Segment
2 The Mounting variation describes the eccentricity (rotation) of the anti-glare shield to the
central axis of the segment and is calculated from measure 1-4:
Mountingvariation = Measure1-4(max) – Measure1-4(min)
3 Result view indicates if the values measured are within (green tick) or outside (red cross)
the limits.
4 Mountingvariation(max) is the max. limit allowed for the mounting variation.
5 Analog voltage determined for each segment at 0°, 90°, 180° and 270° (Measure1-4).
6 The Sensorvalue(max/min) defines the limits for the four measured values (Measure
1-4).
7 Graph showing the Mounting variation.
8 Graph showing the values measured at 0°, 90°, 180° and 270° (Measure 1-4).
6 Description of the test results
6.4 Anti-glare shield mounting
Software Manual SIPLACE Head Verification 03/2018 43
6.4.3 Interpretation of the results obtained
‘Mounting variation’ error for all segments
Cause Solution
Incorrect position of the Z-axis bottom light bar-
rier
► Readjust the Z-axis bottom light barrier
position.
Z-axis bottom light barrier defective (all values
shown in Measure 1 - Measure 4 are below the
limit).
► Replace the complete Z-axis unit including
the bottom light barrier.
Z-axis motor or linear guide defective. ► Replace the complete Z-axis unit.
‘Mounting variation’ error for individual segments
Cause Solution
Anti-glare shield polluted, with fractures or sit-
ting improperly at the DP station.
► Realign or replace the anti-glare shield.
‘Measure 1-4’ error for multiple segments (not concave / not convex)
Cause Solution
Cable breakage at Z-axis down light barrier bot-
tom.
► Replace the Z-axis down light barrier bot-
tom.
6 Description of the test results
6.5 CS Sensor voltage and z-heights
44 Software Manual SIPLACE Head Verification 03/2018
6.5 CS Sensor voltage and z-heights
6.5.1 Measurement principle
The CS Sensor voltage and z-heights measurement is used to determine the function of the
component sensor and the Z-axis values during the upward and downward movement.
The component sensor function is checked by verifying the analog voltage value in its uncovered
state to be within the defined limits. Following a height reference run every segment is moved down
and back up again whereby it is checked at which position the nozzle interrupts and releases the
light barrier.
6.5.2 Measurement result
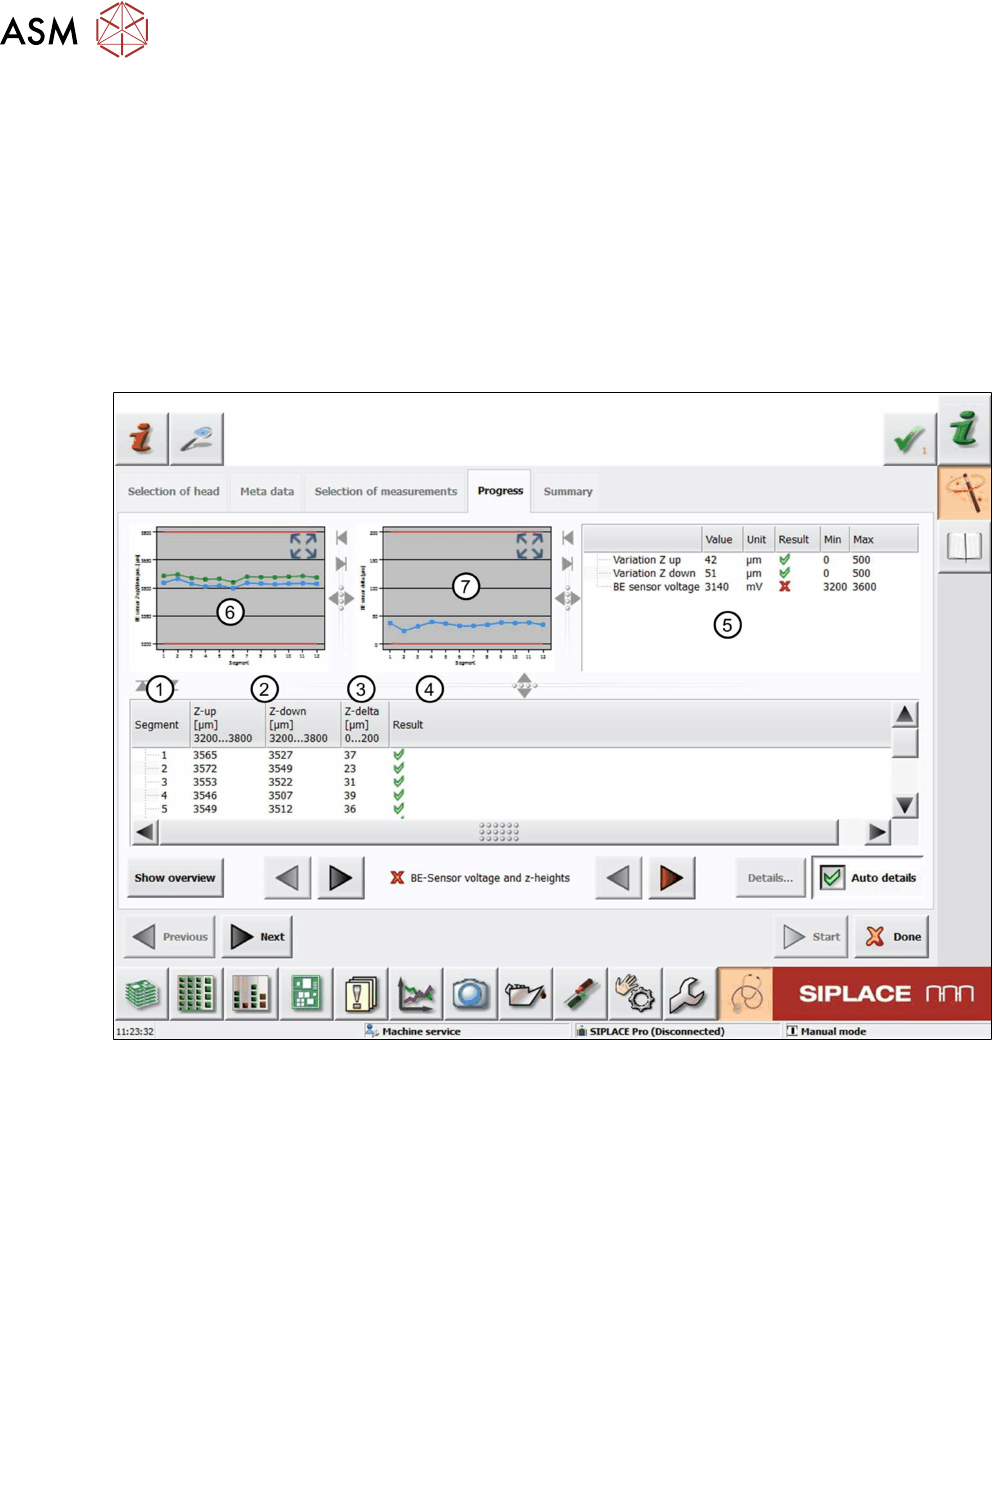
Fig.37: Result view – CS Sensor voltage and z-heights measurement
1 Measured Segment
2 Position that is determined when the light barrier gets interrupted during the downward
movement (Z-down) and released during the upward movement (Z-up).
3 Z-delta shows the difference (hysteresis) between Z-down and Z-up:
●
Z-delta = Z-down – Z-up
4 Results display indicating if the values are within (green tick) or outside (red cross) the lim-
its.
5
●
Variation Z up and Variation Z down show the difference between the largest and
smallest value determined:
Variation Z up = Z-up
max
–Z-up
min
Variation Z up = Z-up
max
– Z-up
min
●
BE sensor voltage shows the analog voltage measured.
6 Graph showing the Z-down (blue) and Z-up (green) values for each segment.
7 Graph showing the Z-delta value (hysteresis) for each segment.