00197787-02_SI_SIPLACE_HeadVerification_EN.pdf - 第54页
6 Description of the test results 6.11 Force measurement for C&P heads 54 Software Manual SIPLACE Head Verification 03/2018 6.11 Force measurement for C&P heads 6.11.1 Measurement principle During force measureme…
6 Description of the test results
6.10 Filter Disc
Software Manual SIPLACE Head Verification 03/2018 53
6.10.3 Interpretation of the results obtained
‘Filter disk OK’ error for all segments
Cause Solution
Holding circuit clogged ► Clean the holding circuit or replace it.
Filter disks clogged ► Replace the filter disks.
‘Filter disk OK’ error for individual segments
Cause Solution
Filter disks clogged ► Replace the filter disk.
6 Description of the test results
6.11 Force measurement for C&P heads
54 Software Manual SIPLACE Head Verification 03/2018
6.11 Force measurement for C&P heads
6.11.1 Measurement principle
During force measurement, the placement force is measured for each segment at an angle of 0°,
90°, 180° and 270°.
Depending on the head to be verified, the following force measurements are available:
●
Force LS (dynamic)
●
Force 01005 (dynamic)
●
Force 5N (dynamic)
●
Force 10N (dynamic)
6.11.2 Measurement result
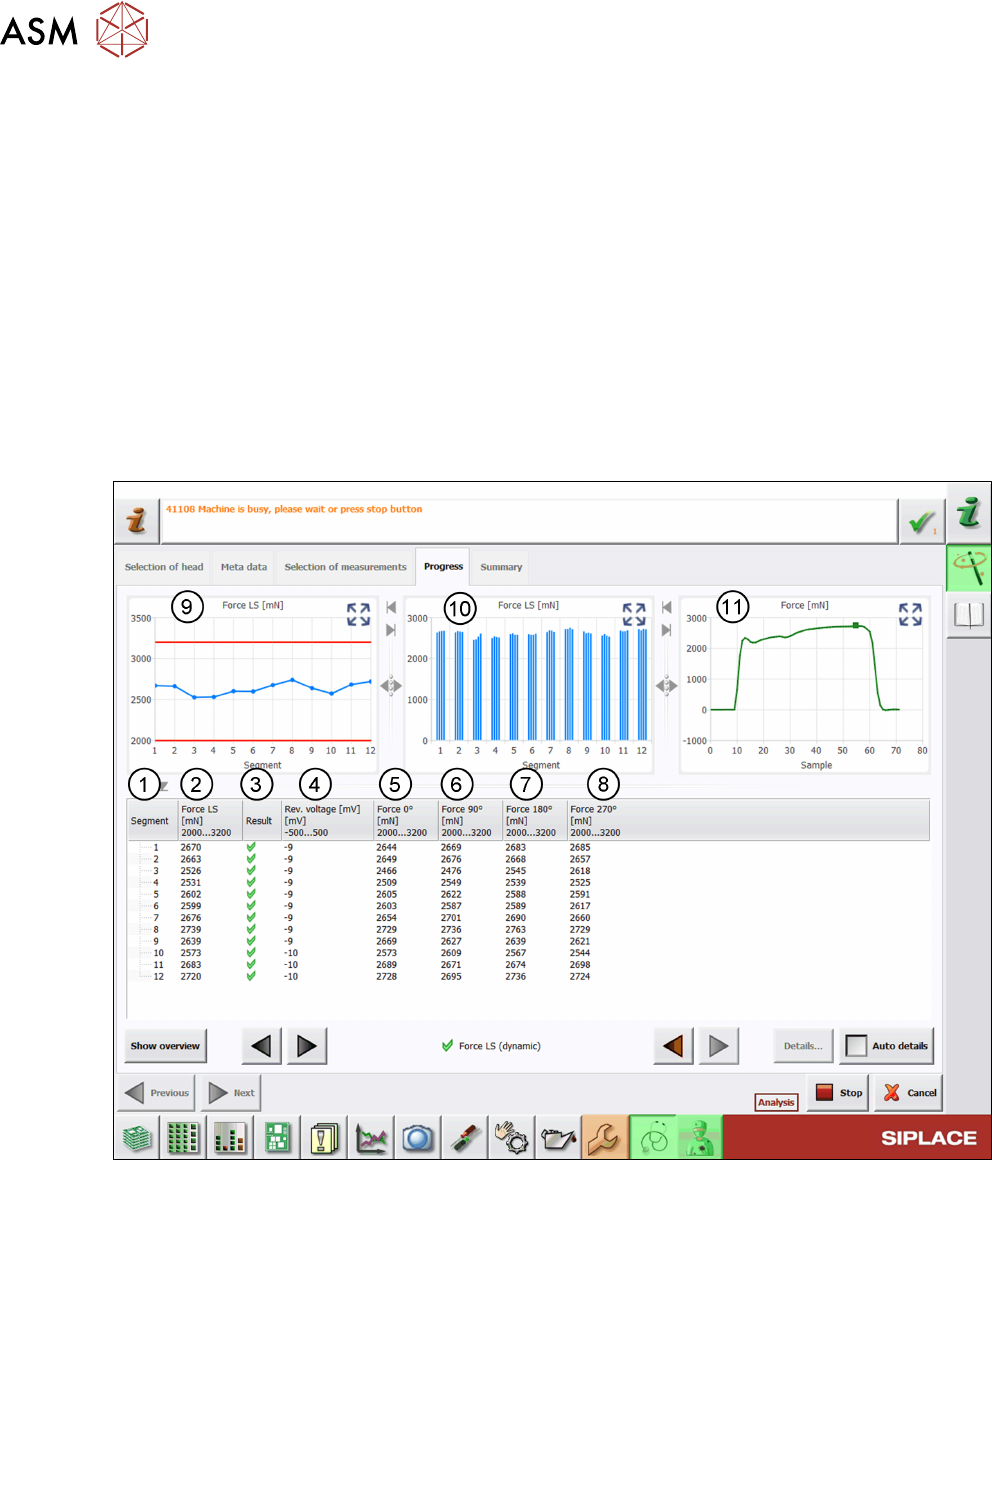
The following image shows an example of the ForceLS(dynamic) measurement:
Fig.43: Result view – Force LS (dynamic)
1 Measured Segment
2 The Force column shows the mean value of the forces measured at different angles:
Force
(n)
= Mean Force
(n0°, n90°, n180°, n270°)
3 Result view indicating if the values are within (green tick) or outside (red cross) the limits.
4 Values of the Rev. voltage measurement show the reference voltage during the measure-
ment.
Always check for a low reference voltage as otherwise this can limit the available measure-
ment range.
5 Values of the Force0° measurement
6 Values of the Force90° measurement
6 Description of the test results
6.11 Force measurement for C&P heads
Software Manual SIPLACE Head Verification 03/2018 55
7 Values of the Force180° measurement
8 Values of the Force270° measurement
9 Graph showing the Force values for each segment.
10 Graph showing the Force values measured at the 4 different angles.
11 Graph showing a sample of the Force measurement in detail.
6.11.3 Interpretation of the results obtained
‘Force’ error for all segments
Cause Solution
Z-Axis strong running / defective ► Exchange of Z-axis if possible.
► -Exchange head / send in head for repair.
‘Force’ error for individual segments
Cause Solution
Linear guide of segment (DP) strong run-
ning / defective
► Exchange segment (DP).