00197787-02_SI_SIPLACE_HeadVerification_EN.pdf - 第64页
6 Description of the test results 6.15 Head endurance run 2N 64 Software Manual SIPLACE Head Verification 03/2018 6 Results for the individual measurements: ● Result display indicating if the values are within (green tic…
6 Description of the test results
6.15 Head endurance run 2N
Software Manual SIPLACE Head Verification 03/2018 63
6.15 Head endurance run 2N
6.15.1 Measurement principle
The Head endurance run measurement checks the reliability of the D-axis and the Z-axis for the
standard range of components which are typically processed using the standard placement para-
meter.
When the Z-axis is verified, the segment is moved up and down several times to determine the
characteristics during the upward and downward movement. Before each downward movement,
the D-axis is turned by 180° and the time is measured that it takes to reach the target position.
6.15.2 Measurement result
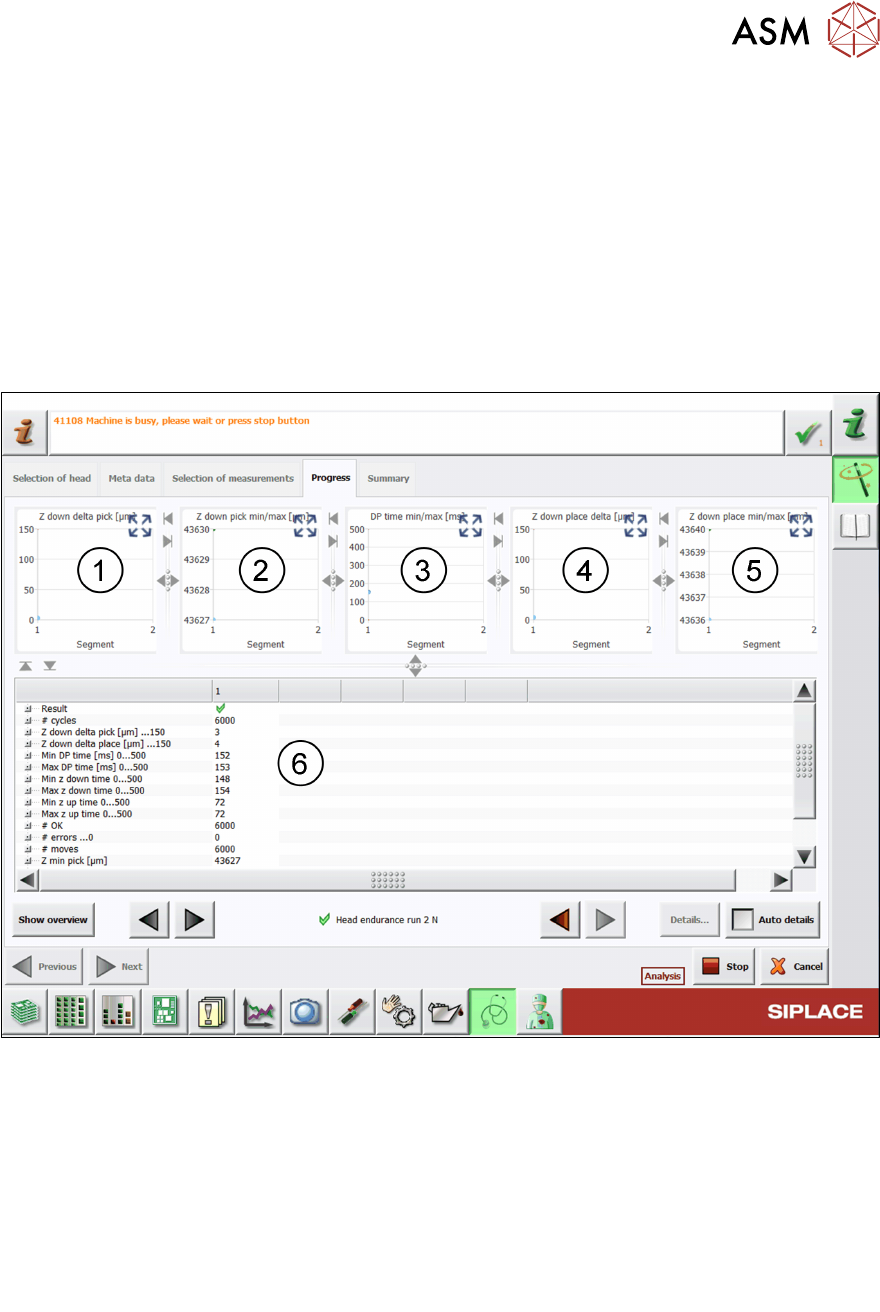
Fig.48: Result view – Head endurance run 2 N
1 Graph showing the Z down delta pick values for each segment.
2 Graph showing the Z down pick min (blue) and Z down pick max (green) values for each
segment.
3 Graph showing the DP time min (blue) and DP time max (green) values for each seg-
ment.
4 Graph showing the Z down delta place values for each segment.
5 Graph showing the Z down place min (blue) and Z down place max (green) values for
each segment.

6 Description of the test results
6.15 Head endurance run 2N
64 Software Manual SIPLACE Head Verification 03/2018
6 Results for the individual measurements:
●
Result display indicating if the values are within (green tick) or outside (red cross) the
limits.
●
Total number of cycles performed.
●
Value for difference between Z min pick and Z max pick:
Z down delta pick = Z max pick – Z min pick.
●
Value for difference between Z min place and Z max place:
Z down delta place = Z max pick – Z min place.
●
Min Dp time and Max DP time determined that the D-axis needs to turn by 180°.
●
Min z down time and Max z down time determined that the Z-axis needs to move
down completely.
●
Min z up time and Max z up time determined that the Z-axis needs to move back up.
●
# OK shows if all cycles have been successfully completed.
●
# errors shows the number of recognized errors.
6.15.3 Interpretation of the results obtained
‘Z down delta pick’ and ‘Z down delta place’ or ‘Min z up time’ and ‘Max z up time’
error
Cause Solution
Blockage at the Z-axis linear bearing ► Check / maintain the linear bearing.
Z-axis drive and/or linear bearing defective ► Check / maintain the linear bearing.
► Replace the P&P module.
► Send the P&P module to ASM for cus-
tomer specific repair.
‘Min DPtime’ and ‘Max DP time’ error
Cause Solution
Encoder disk or read polluted ► Clean the encoder disk / read head
(Q1/2018).
Encoder disk or read defective ► Replace the ‘Trick a. feather unit/P+P
module (Q1/2018)’.
► Replace the P&P module.
► Send the P&P module to ASM for cus-
tomer specific repair.
6 Description of the test results
6.16 Head endurance run LS
Software Manual SIPLACE Head Verification 03/2018 65
6.16 Head endurance run LS
6.16.1 Measurement principle
The Head endurance run LS measurement checks the reliability of the Z-axis and the DPs, espe-
cially for the standard range of components which are typically processed using the standard
placement parameter.
When the Z-axis is verified, each segment is moved up and down several times to determine the
characteristics during the upward and downward movement. Before every downward movement,
the DP is turned by 180° with the time measured it takes to reach the final position.
6.16.2 Measurement result
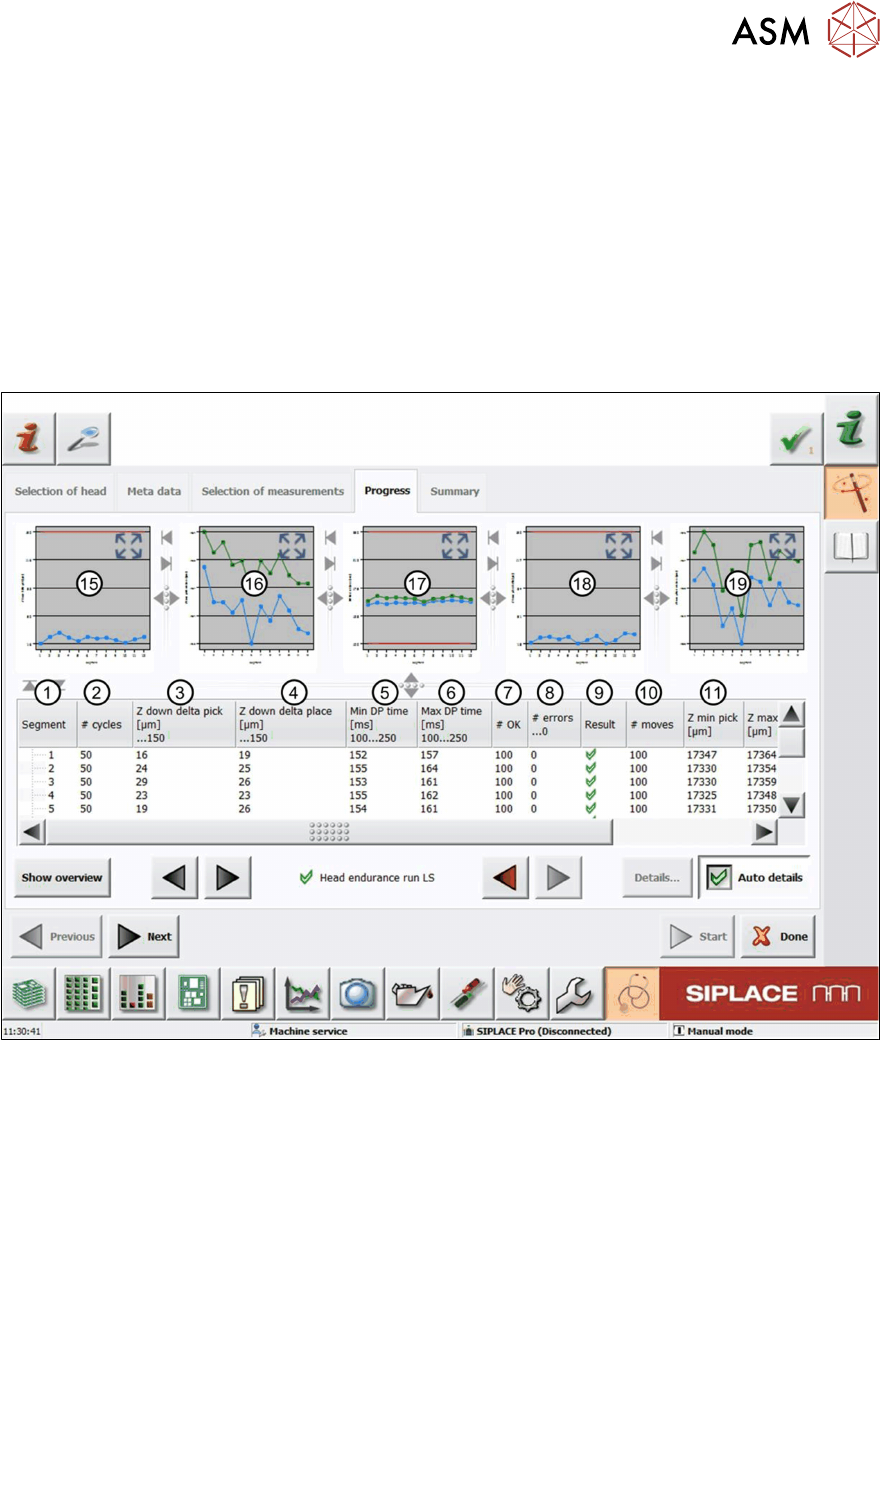
Fig.49: Result view – Head endurance run LS 1/2
1 Measured Segment
2 Total number of cycles performed
3 Value for difference between Zminpick and Zmaxpick:
Zdowndeltapick = Zmaxpick – Zminpick
4 Value for difference between Zminplace and Zmaxplace:
Zdowndeltaplace = Zmaxpick – Zminplace
5 MinDPtime shows the value for the minimum time the DP needs to turn from 0° to 180°.
6 MaxDPtime shows the value for the maximum time the DP needs to turn from 180° to 0°.
7 #OK shows the number of successful Z-axis movements (50 up + 50 down).
8 #error…0 shows the number of failed Z-axis movements (up and down).
9 Result display indicating if the values are within (green tick) or outside (red cross) the lim-
its.
10 #moves shows the number of performed Z-axis movements (50 up + 50 down).