4OM-1064-001.pdf - 第73页
9910-001 Tg0249-PM-MM 3.3 Management Data (T ype 1) Keys and menus related to production performance of the machine are pro- vided, enabling the checking of overall performance data. When the [MANAGEMENT DA T A (TYPE 2)]…

Tg0249-PM-MM
“Saved Data” : Shown are the parameters calculated just before the cur
rent parameters.
“Current Data” : Shown are the parameters being calculated at present.
Examples in Figs. 3.12-1 and 3.12-2:
MANAGEMENT DATA NOZ. BYPASS RATE 25/500: Numerator 25 shows
the number of pick-up errors detected before 500 components are picked up.
Denominator 500 shows that 500 components are to be picked up. When 25
pick-up errors are detected, a message appears in the “MGT. INFO.” text box,
indicating that the pick-up rate has deteriorated and the nozzle is automatically
bypassed. When the number of pick-up errors does not reach “25” after 500
components are picked up. XX/XX is reset to “00/00” and counting starts
again.
The “NOZZLE BYPASS RATE (SAVED DATA)” shows the parameters just
before this delimiter.
• When a nozzle is automatically bypassed, the blue head No. related to the
bypassed nozzle turns red at the “NOZZLE BYPASS RATE (SAVED
DATA)” display.
9910-001 3-26
3. MANAGEMENT DATA Display
9910-001 Tg0249-PM-MM
3.3 Management Data (Type 1)
Keys and menus related to production performance of the machine are pro-
vided, enabling the checking of overall performance data.
When the [MANAGEMENT DATA (TYPE 2)] key is pressed at the “MAN-
AGEMENT DATA” display, the “MANAGEMENT DATA (TYPE 2)” dis-
play appears, enabling the checking of almost the same items as those of the
“MANAGEMENT DATA (TYPE 1)” display. Distinguish between manage-
ment spans and check the required items.
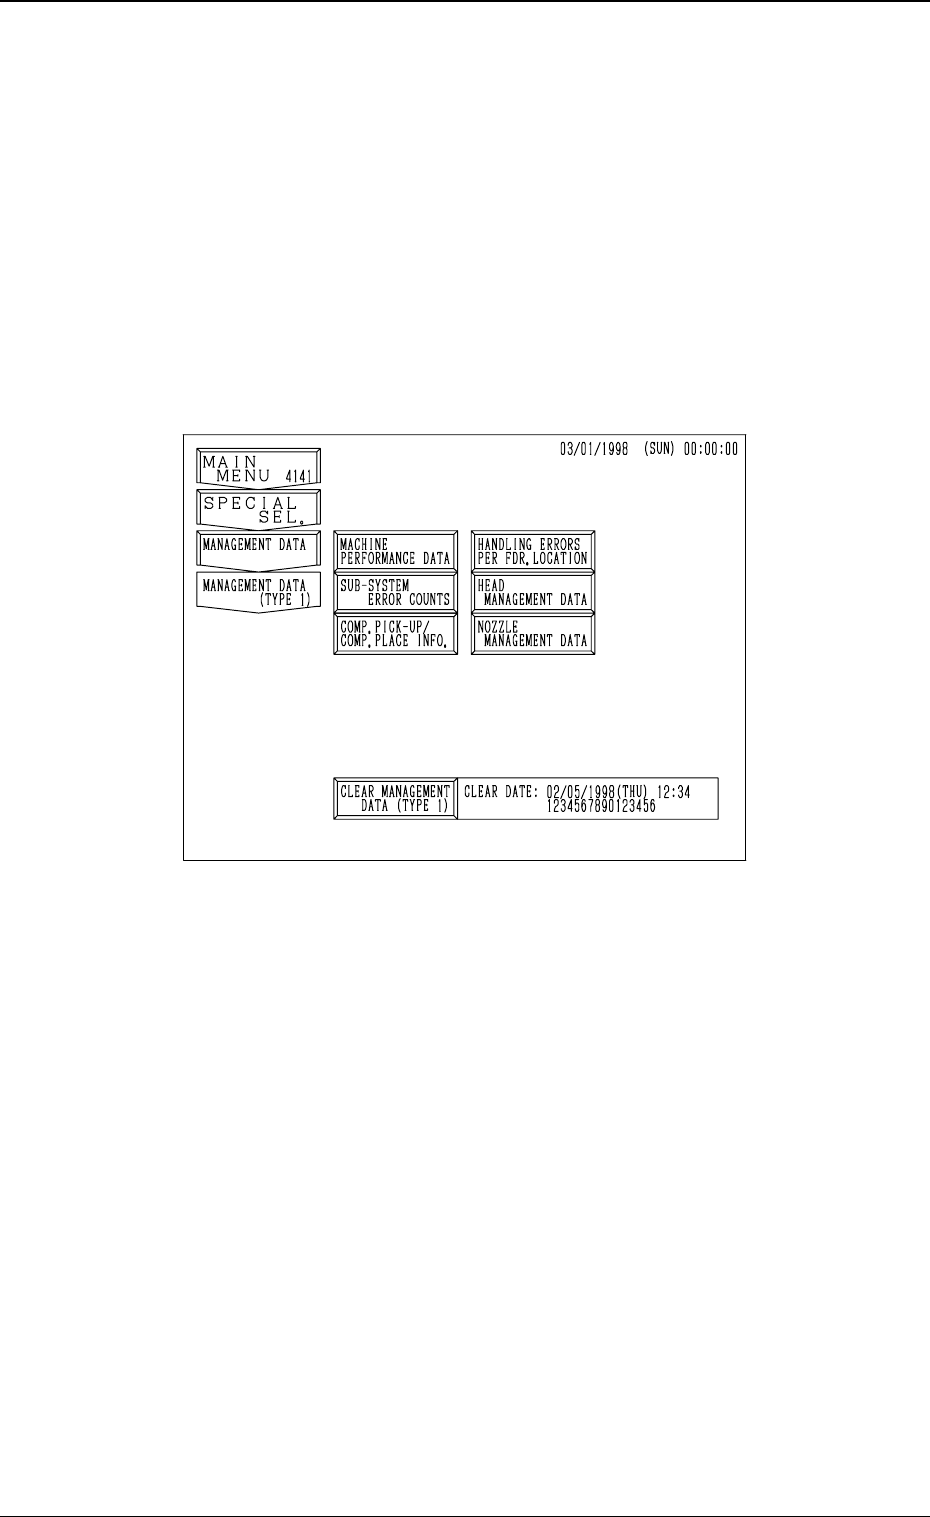
When the [MANAGEMENT DATA (TYPE 1)] key is pressed at the “MAN-
AGEMENT DATA” display, the following display appears on the screen.
3-27
3. MANAGEMENT DATA Display
Fig. 3.13
9910-001 Tg0249-PM-MM
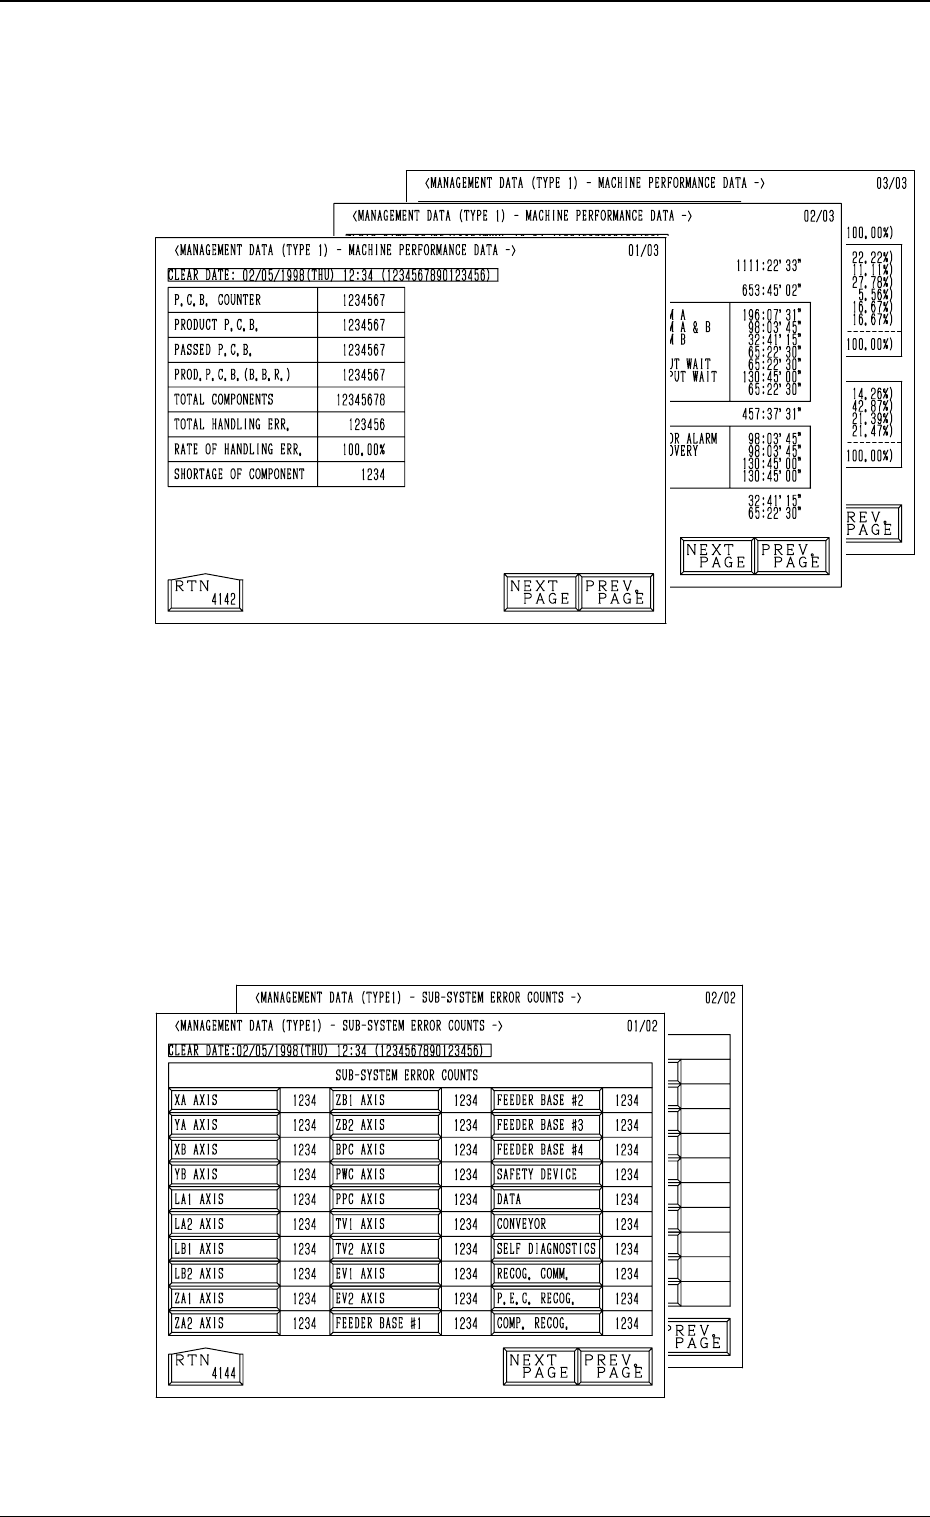
3.3.1 MACHINE PERFORMANCE DATA
When the [MACHINE PERFORMANCE DATA] key is pressed at the “MAN-
AGEMENT DATA (TYPE 1)” display, the following display appears on the
screen.
• This display looks similar to the “PATTERN PROGRAM MANAGEMENT
DATA - MACHINE PERFORMANCE DATA” display. Eachparameter is
based on management data of the machine (not on each pattern program).
(Refer to “3.1 (2) Machine Performance Data” for details.
3.3.2 SUB-SYSTEM ERROR COUNTS
When the [SUB-SYSTEM ERROR COUNTS] key is pressed at the
“MANAGEMENT DATA (TYPE 1)” display, the following display ap-
pears on the screen.
• Shown is the total number of errors which occurred on each device
during automatic operation.
• When each data key is pressed, the corresponding display appears, enabling
the checking of detailed information of the selected device or function where
an error(s) occurred.
3-28
3. MANAGEMENT DATA Display
Fig. 3.14
Fig. 3.15