SIPLACE Vision Customer_en.pdf - 第59页
Component Shapes Optical Recognition and Evaluation of Un leaded COs Specific Component Shapes S tudent Guide SIPLACE Vision (Customer) Edition 12/2008 EN Component Shapes 59 Diagram presentation positionPresentation Pos…
Component Shapes
Specific Component Shapes Optical Recognition and Evaluation of Unleaded COs
Student Guide SIPLACE Vision (Customer)
Component Shapes Edition 12/2008 EN
58
Due to the very simple programming method, involving body size with attached wraparound leads, NO
component shape wizard is offered for molded component shapes.
SW extension: FaceDown recognition can be programmed and used from SC 702.01 SW (SIPLACE
Vision 4.1).
Lead length inspection can be programmed and used for molded component shapes from SC 702. (See:
New Siplace Vision Functions 702).
5.3.6 Optical Recognition and Evaluation of Unleaded COs
Based on the example of a molded CO (Tantal capacitor)…
A leaded CO is processed with the following measurement steps:
1. Position recognition through determination of the following measurement values:
1. Coarse position - quick determination of component position.
2. Coarse angle - quick determination of angle.
3. Fine angle - exact measurement of angle.
4. Fine position - exact measurement of component position.
2. Component inspection via dimension check.
If the specified tolerances are exceeded, the component concerned will not be placed.
5.3.6.1 Position Determination for Unleaded COs
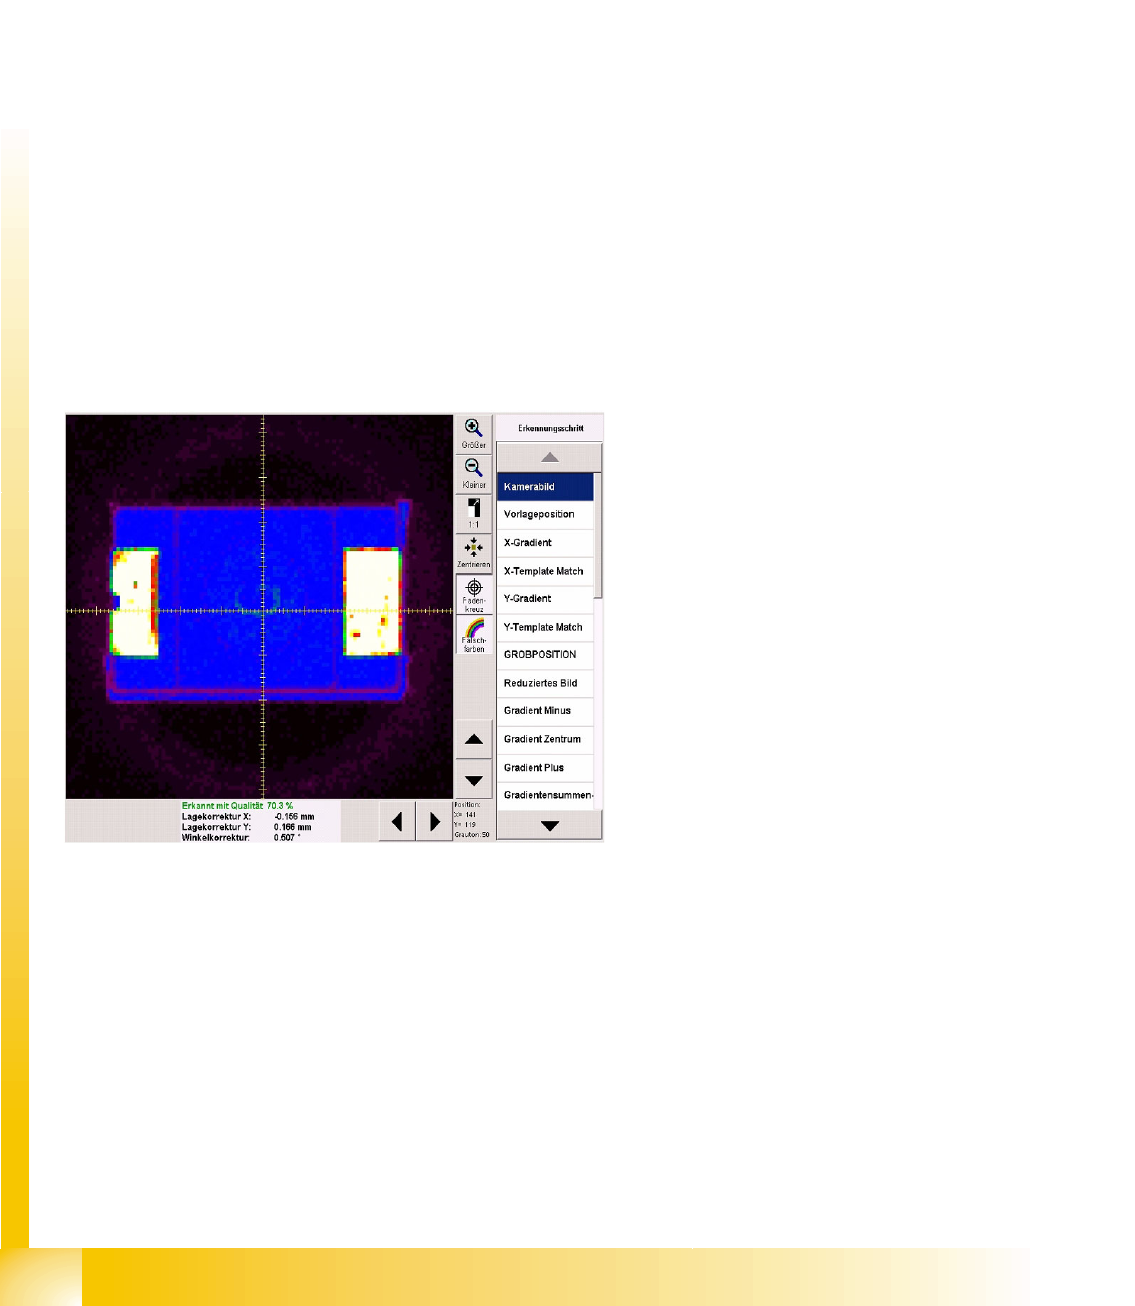
Diagram unprocessed camera image
The brightness and contrast can be assessed
more easily by switching over to pseudo-color
display:
In this example, White shows the CO
connection points for the Wraparound leads.
Blue shows the dark CO plastic body; the
darker edges are displayed in purple.
Purple/black shows the nozzle/segment
background.
The pickup accuracy can also be recognized on
the camera image and in the measurement
results:
The pickup accuracy is higher the more
accurately the CO center matches the camera
center or the lower the position correction factor is
(X, Y).
Various measurement steps are performed,
depending on the CO type. The individual steps
are explained in the following example.
Component Shapes
Optical Recognition and Evaluation of Unleaded COs Specific Component Shapes
Student Guide SIPLACE Vision (Customer)
Edition 12/2008 EN Component Shapes
59
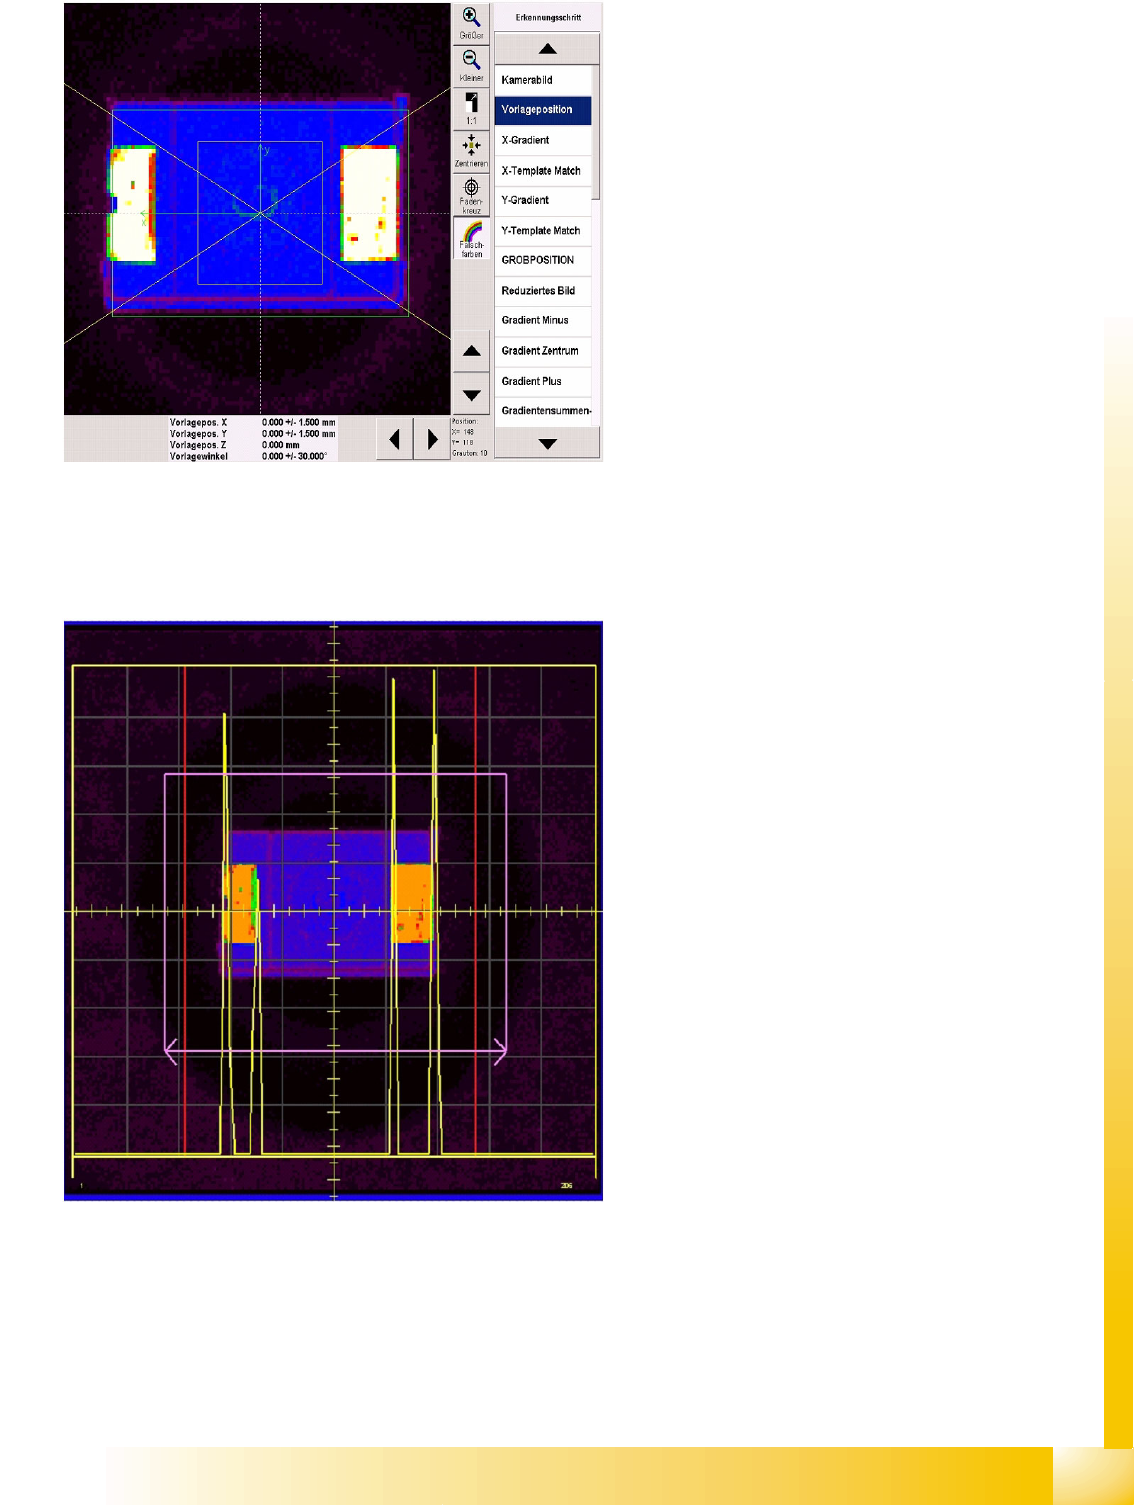
Diagram presentation
positionPresentation Position
The green arrows show the CS coordinate
system (positive direction in each case).
The yellow square shows the tolerance field
in which the CO center must be positioned.
This can be programmed at Pick-up tolerance.
The green rectangle maps the programmed
overall CO size.
A slanted yellow cross (V pointing to the left)
shows the permitted CO angle tolerance for
the optical centering function.
The CO positions have not yet been
determined, which is why the presentation
position values are 0.000. The position
tolerance (+/- 1.500) shows the SIPLACE Pro
setting. This describes the tolerance which the
CO may have, without error messages being
issued or rejection occurring.
Results diagram X gradient recognition
stepX Gradient
The yellow square shows the Region of Interest
(ROI) derived from the CS size/tolerance and the
pickup tolerance.
The purple rectangle shows the maximum CO
size.
The purple arrows point in the direction of
measurement: parallel to the camera's X
coordinate axis.
Yellow gradient signal curve:
The large outer signal peaks, to the left and
right, show where the lead and body begin,
The smaller signal peaks show the brightness
of the lead ends against a background of the
dark component body.
The red horizontal lines shows the limits which
the gradients must be within. Inside these limits,
the gradient signal is compared with the
programmed size template.
Component Shapes
Specific Component Shapes Optical Recognition and Evaluation of Unleaded COs
Student Guide SIPLACE Vision (Customer)
Component Shapes Edition 12/2008 EN
60
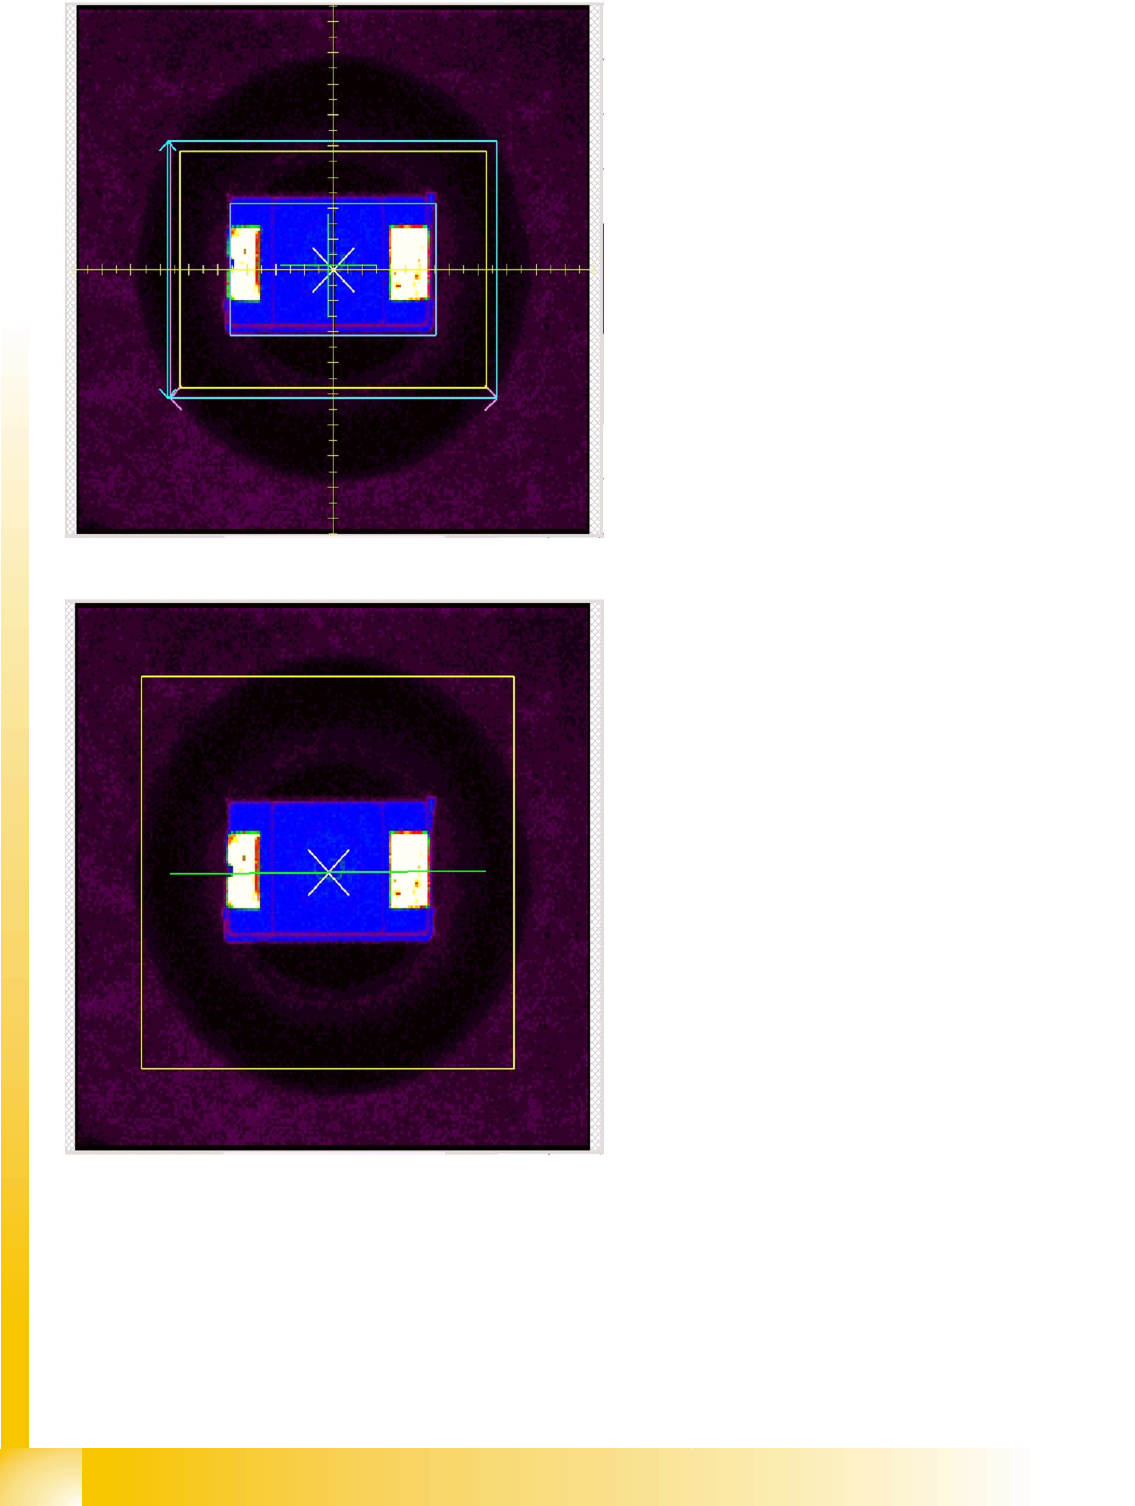
Results diagram: Coarse position
recognition step
The yellow rectangle shows the search field
for CO features.
The light blue rectangle shows the
measurement window for the Y gradient
measurement.
The small, light blue rectangle shows the
CO size in the determined CO coarse position.
The green cross shows the segment center
(around which the CO would be rotated, when
required).
The white 45° cross shows the determined
CO coarse position.
This CO coarse position is used as the basis
for alignment of the measurement window in
the next measurement step Coarse angle.
Results diagram: Coarse angle
recognition step
The yellow rectangle shows the Region of
Interest (ROI).
After determining the coarse position
(previous measurement step), the system now
determines the angle of the component.
The result is shown as a green line. The
coarse position and coarse angle then form
the basis for alignment of the fine position
measurement window.