2OM-1751-003w_G5S.pdf - 第249页
2OM-1751 4-35 1303-001 [5] [6] [7] [2] [1] [3] [4] [8] "Feeder Message Rate" Tab Sheet (1/2) F2D22 [11] [10] [13] [12] [9] "Feeder Message Rate" Tab Sheet (2/2) F2D23 [1] Feeder No. (Actual Fdr No.) S…
2OM-1751
4-341303-001
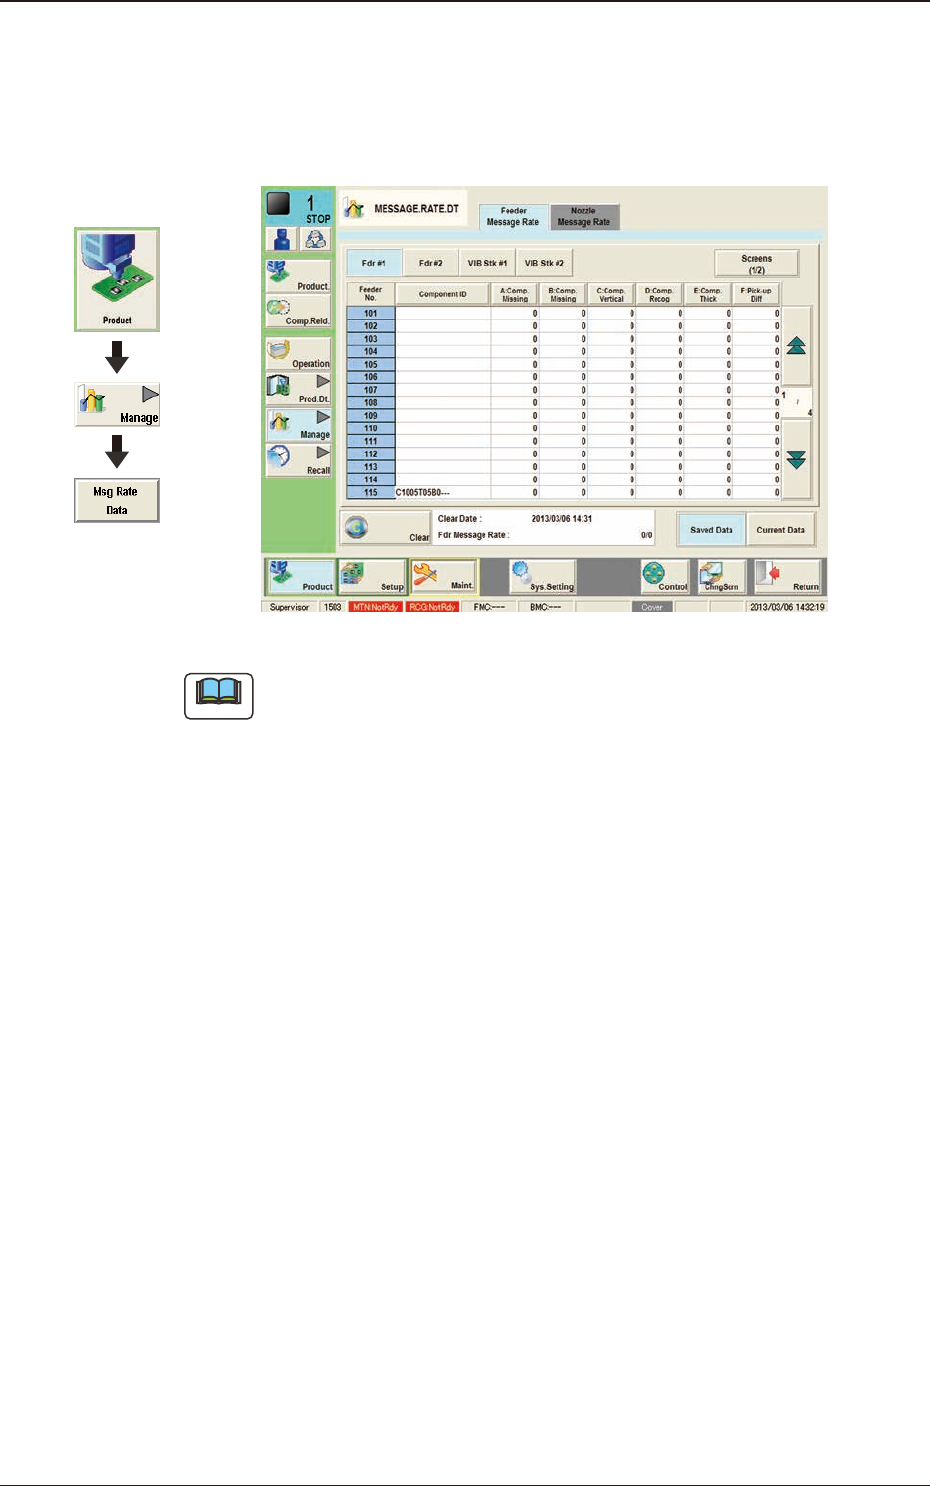
4. "MESSAGE.RATE.DT" Window
4.1 "Feeder Message Rate" Tab Sheet
F2D21
Note
(a) The displayed tab sheet will look different, depending on which option is
selected.
(b) Each item box functions as a button and each pressing of the buttons can
list the data parameters in descending order. The top box shows the largest
value for error times. Therefore, it is useful for the analysis to enhance the
operation rate. When the [Feeder No.] button is pressed, the Nos. are re-
arranged in their initial order (Feeder Nos.).
The "Feeder Message Rate" tab sheet is divided further into several tabs and each
button shows the handling errors per feeder on each individual feeder bases.
When each button is pressed, the corresponding tab sheet appears.
Graphic
Development
4. "MESSAGE.RATE.DT" Window
2OM-1751
4-351303-001
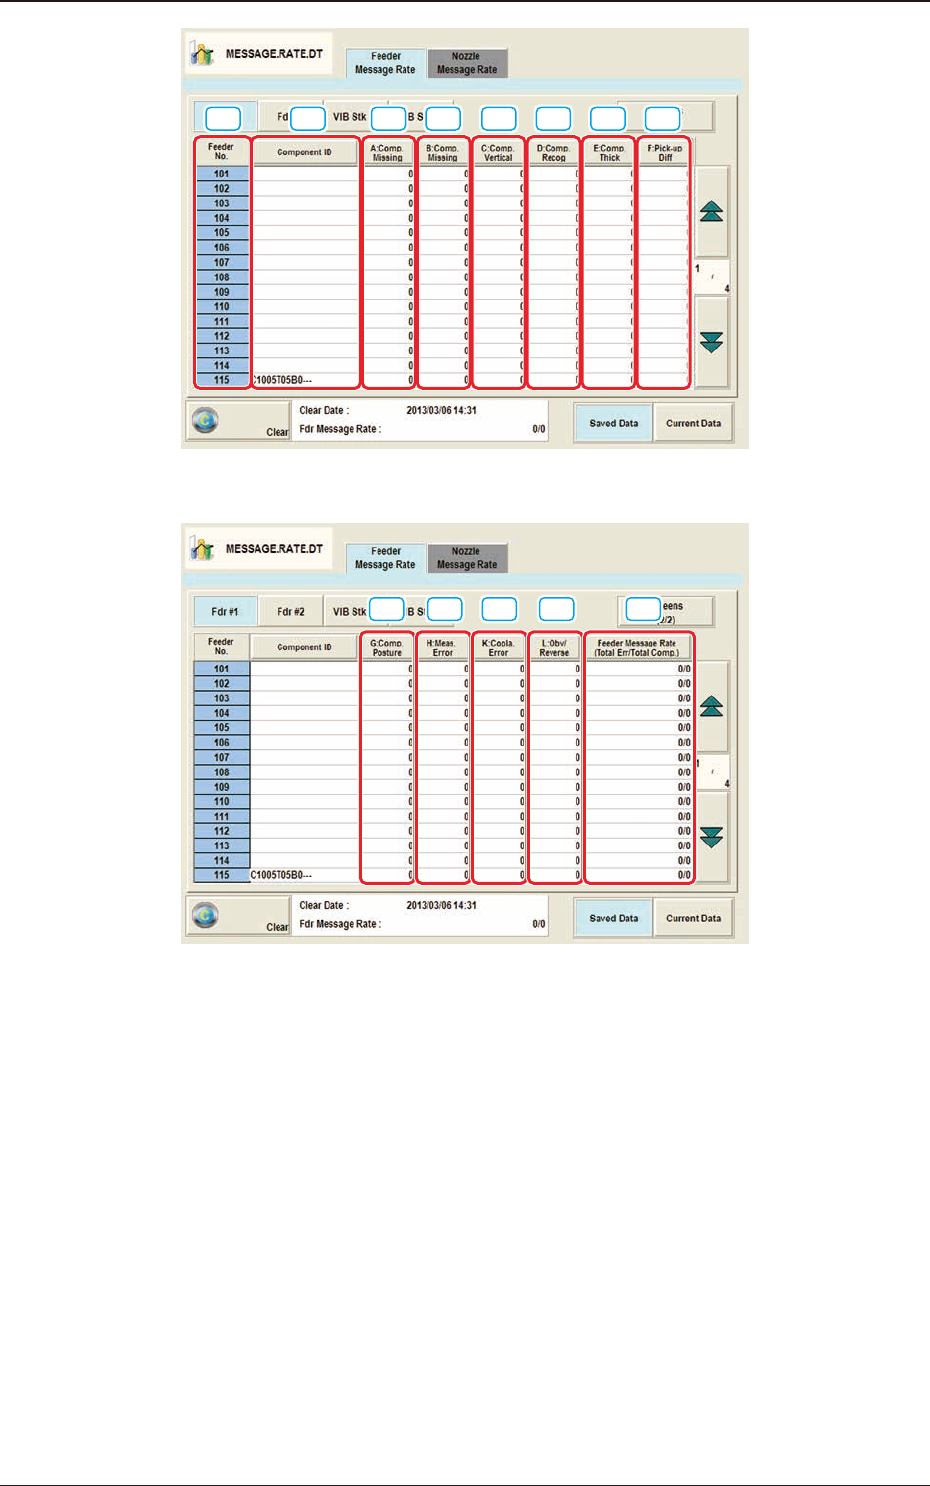
[5] [6] [7][2][1] [3] [4] [8]
"Feeder Message Rate" Tab Sheet (1/2) F2D22
[11][10] [13][12][9]
"Feeder Message Rate" Tab Sheet (2/2) F2D23
[1] Feeder No. (Actual Fdr No.)
Shown are the feeder Nos.
[2] Component ID
Each text box shows the component IDs for each individual feeders.
[3] A:Comp. Missing
Each text box shows the total number of missing components detected by the
linear measure detection sensor for each individual feeders.
[4] B:Comp. Missing
Each text box shows the total number of missing components detected
through recognition operation for each individual feeders.
4.1 "Feeder Message Rate" Tab Sheet

2OM-1751
4-361303-001
[5] C:Comp. Vertical
Each text box shows the total number of vertical component errors detected
by the linear measure detection sensor for each individual feeders.
[6] D:Comp. Recog
Each text box shows the total number of errors detected through recognition
operation for each individual feeders.
[7] E:Comp. Thick
Each text box shows the total number of errors in component thickness
detected by the linear measure detection sensor for each individual feeders.
[8] F:Pick-up Diff
Each text box shows the total number of pickup difference errors detected in
the recognition process for each individual feeders.
[9] G:Comp. Posture
Each text box shows the total number of reversed component and polarity
judgment errors detected in the recognition process for each individual
feeders.
[10] H:Meas. Error
The No. of measurement error total times for each feeder is displayed in this
data box.
[11] K:Copla. Error
Each text box shows the total count of the "Copla. Error" detection in each
feeder.
[12] L:Obv/Reverse
The "judged front/rear error" times for each feeder, detected using the linear
measure, is displayed in these data boxes.
[13] Feeder Message Rate
(Total Errors / Total Noz. Usage)
Each text box shows the rate of pickup errors (the number of pickup errors
per number of picked component) for each individual feeders.
4.1 "Feeder Message Rate" Tab Sheet