JO-072-006_w.pdf - 第78页
3-25 AKBEG-ID 6.2 Chart There are four kinds of charts. The tabs in the "Chart" window can be used to select a chart. 6.2.1 Line Chart for Errors This line chart indicates the results of inspection for each ind…

3-24
AKBEG-ID
[Print] Button
When pressed, this button prints the item(s) selected by your selection mode.
Select the print options in the "Print Setting" group box.
Accuracy T
able :
The results of up to 50 feeders can be
printed on a piece of A4 paper.
Preview :
The contents (related to up to three
feeders) in the preview window
(displayed on the right pane) can be
printed on a piece of A
4 paper.
Deletes from table after printing :
After printing is executed, the le of
the accuracy results is transferred to
another folder to make it clear if the
le is already printed or not.
(Path to Folder: D:\MeasureComp)
0508-001
6.1 Accuracy Measurement Table
3-25
AKBEG-ID
6.2 Chart
There are four kinds of charts. The tabs in the "Chart" window can be used to
select a chart.
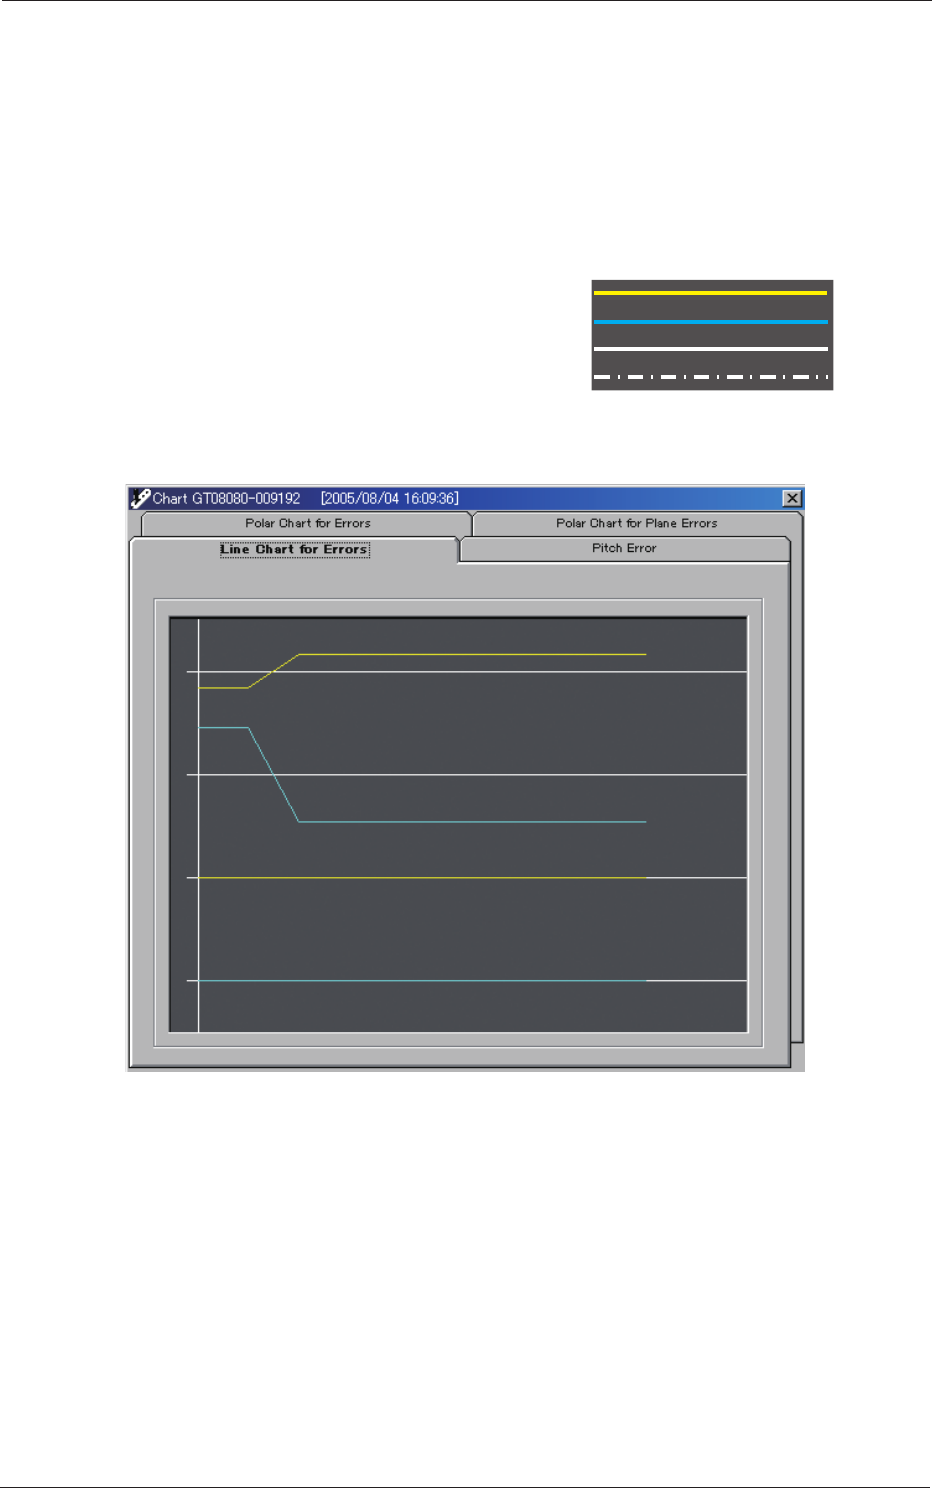
6.2.1 Line Chart for Errors
This line chart indicates the results of inspection for each individual
holes.
Yellow Line :
X Values
Light Blue Line :
Y Values
White Solid Line :
CENTER Values
White Dashed Line :
0 Values
Displayed from the top are "X in Lane #1", "Y in Lane #1", "X in Lane
#2", and "Y in Lane #2".
Fig. C22
0508-001
6.2 Chart
3-26
AKBEG-ID
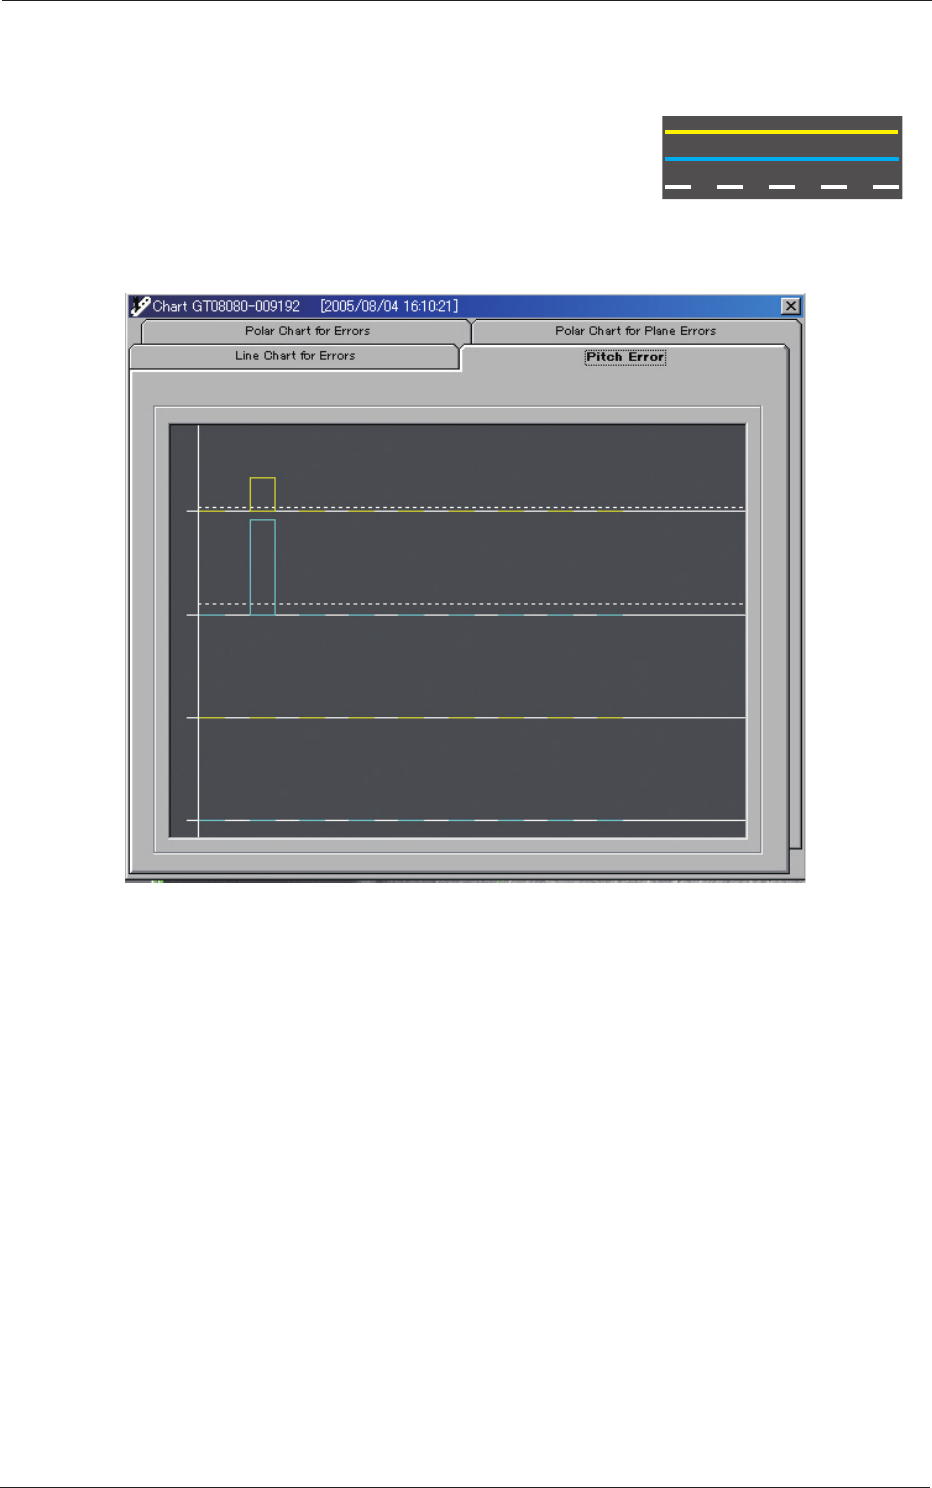
6.2.2 Pitch Error
The pitch-to-pitch errors are displayed, using the absolute values.
Yellow Line :
X Values
Light Blue Line :
Y Values
White Dashed Line :
Mean of Absolute Values
Displayed from the top are "X in Lane #1", "Y in Lane #1", "X in Lane
#2", and "Y in Lane #2".
Fig. C23
0508-001
6.2 Chart