754_____cmeng0000.pdf - 第28页
753/754 Calibration Manual 20 Table 10. Simulate Transmitter Verification Points UUT Range UUT Output Minimum 1-Year Maximum 1-Year Minimum 2-Year Maximum 2-Year 22.000 mA 4 3.99220 4. 00780 3.99140 4.00860 22.000 mA 21 …
Documenting Process Calibrator
Performance Verification Tests
19
Simulate Transmitter Function
To verify the simulate transmitter function (accessed through dc current source function):
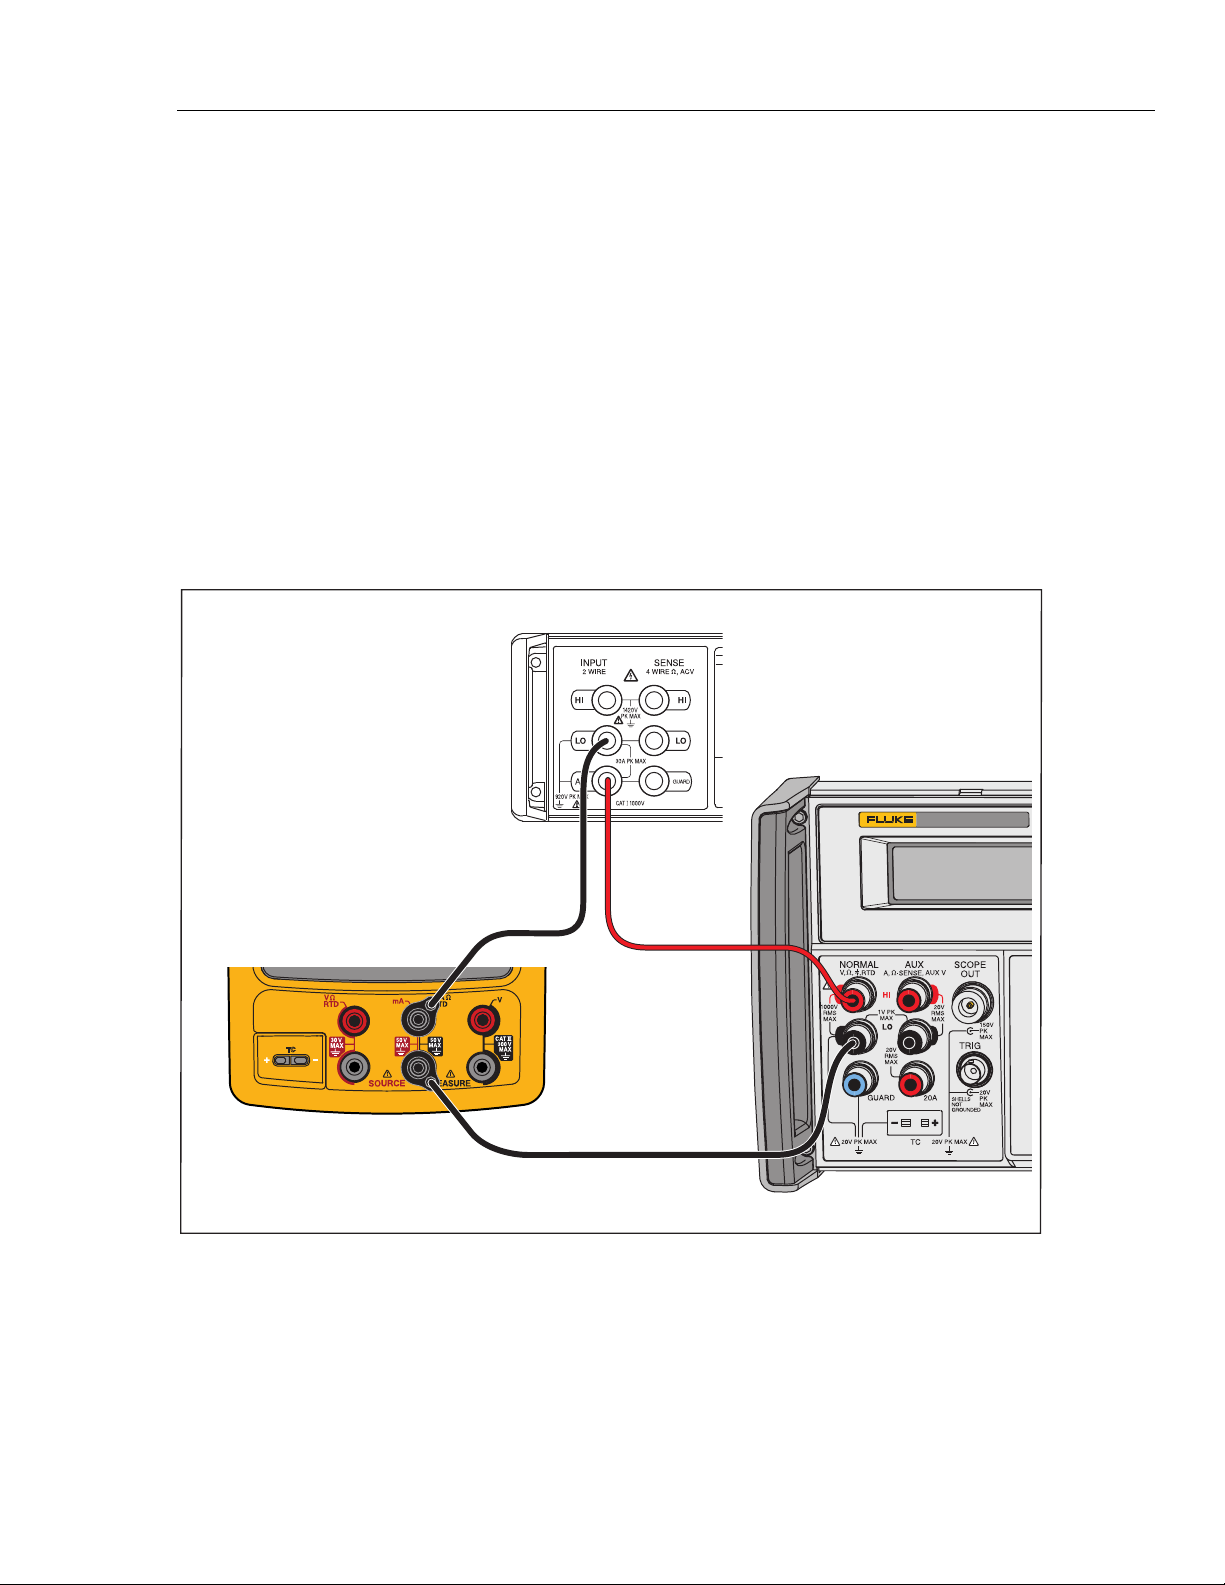
1. Connect the UUT, 8508A, and 5522A as shown in Figure 7. The 5522A is used
as a stable dc voltage source. Its value is not critical, and a different dc source
such as a battery can be used if necessary.
2. Set the 8508A to DC Current .
3. Set the UUT to the [mA Source] function and then select Simulate Transmitter.
4. Set the UUT source value to 4 mA.
5. Set the 5522A to output 8 V dc.
6. See if the value shown on the 8508A is in the range shown in Table 10.
7. Change the UUT source value to 22 mA and examine the results again in Table 10.
8. When you complete the test, set the 5522A to STANDBY and push on the
UUT two times to turn the source function off. This conserves battery life.
5522A
CALIBRATOR
Fluke 75X
Fluke 8508A
Fluke 5522A
gso09.eps
Figure 7. Simulate Transmitter Verification Connections
753/754
Calibration Manual
20
Table 10. Simulate Transmitter Verification Points
UUT Range UUT Output
Minimum
1-Year
Maximum
1-Year
Minimum
2-Year
Maximum
2-Year
22.000 mA 4 3.99220 4.00780 3.99140 4.00860
22.000 mA 21 20.98880 21.01120 20.98460 21.01540
Resistance Source Function
To verify the resistance source function:
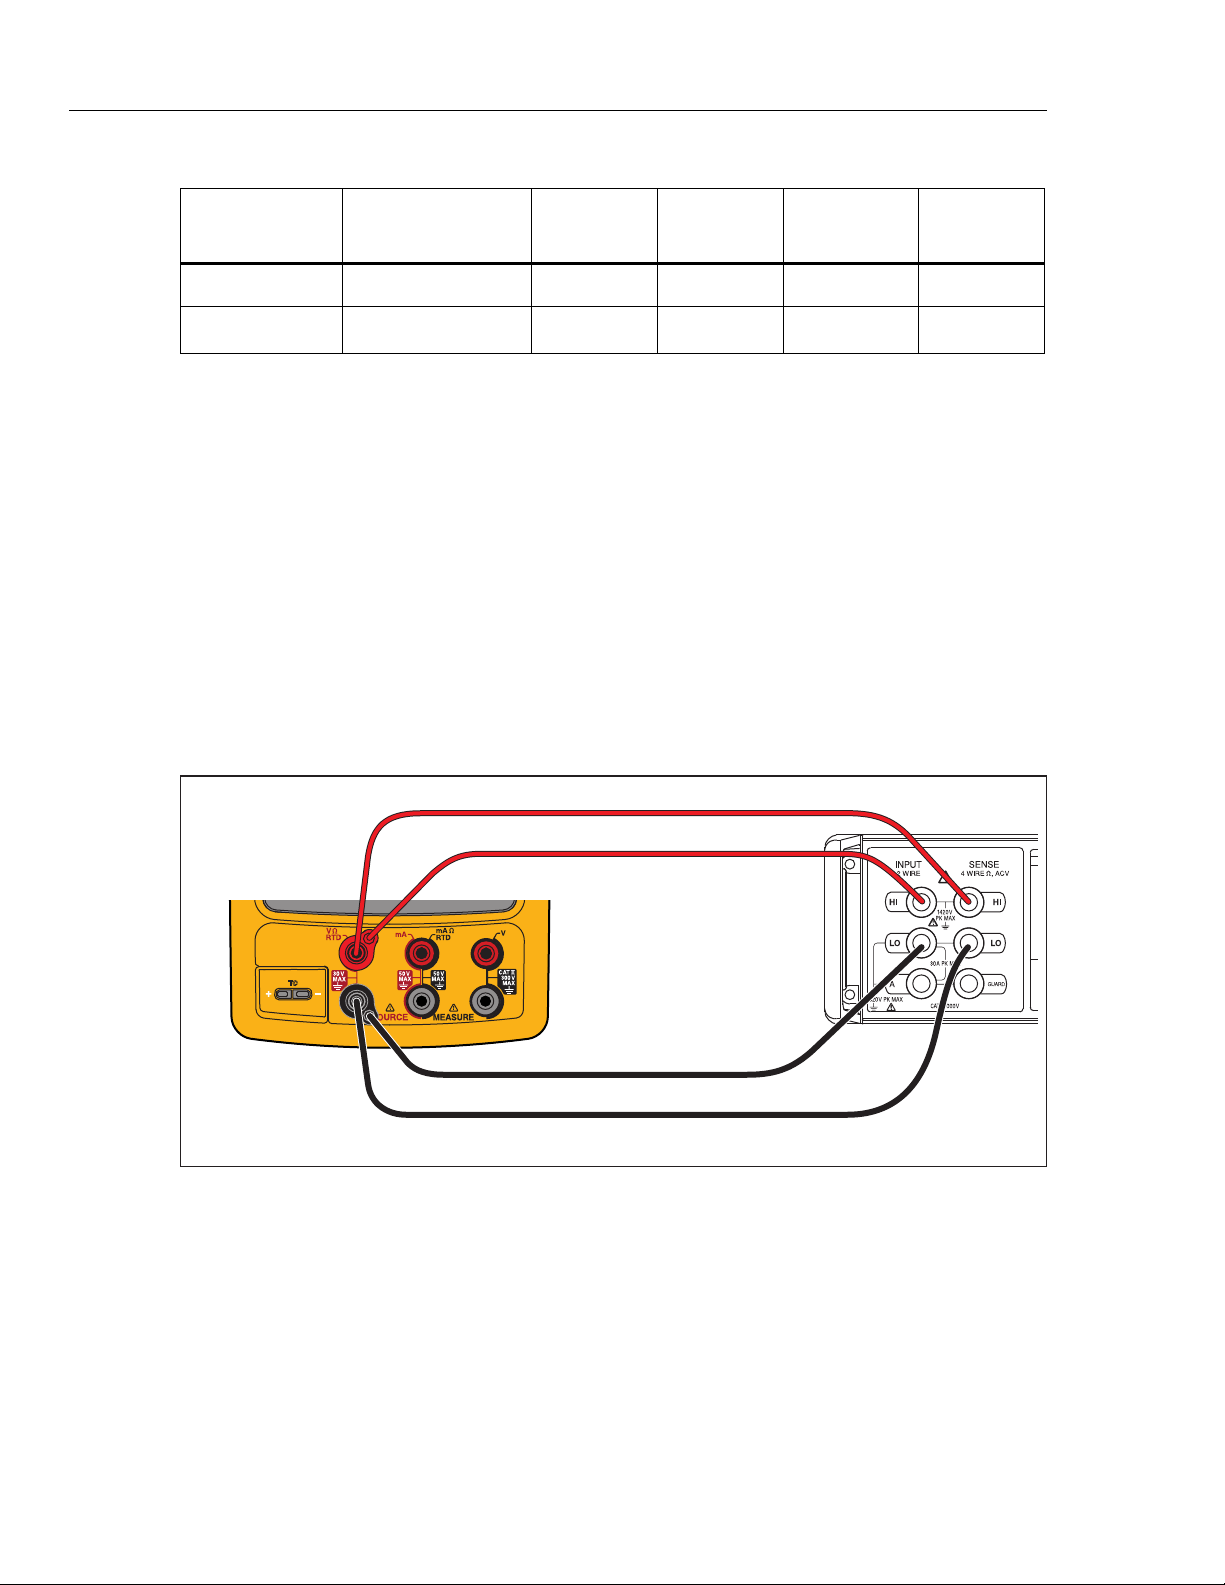
1. Connect the UUT to the 8508A as shown in Figure 8. Use a four-wire connection
transitioning to two wires at the UUT.
2. Set the UUT to the resistance source function at 0.1 Ω.
3. On the 8508A, select four-wire ohms measurement and up-range to the 200 Ω
range. Use the 200 Ω range for the first five tests points, and autorange
thereafter. The low range of the 8508A supplies too much current into the UUT.
4. See if the value shown on the 8508A is in the range shown in Table 11.
5. Continue through the test points. See if the value shown on the UUT is in the
range shown in the applicable column of Table 11.
6. When you complete the test, push on the UUT two times to turn off the
source function. This conserves battery life.
Fluke 75X
Fluke 8508A
gso10.eps
Figure 8. Resistance Source Verification Connections
Documenting Process Calibrator
Performance Verification Tests
21
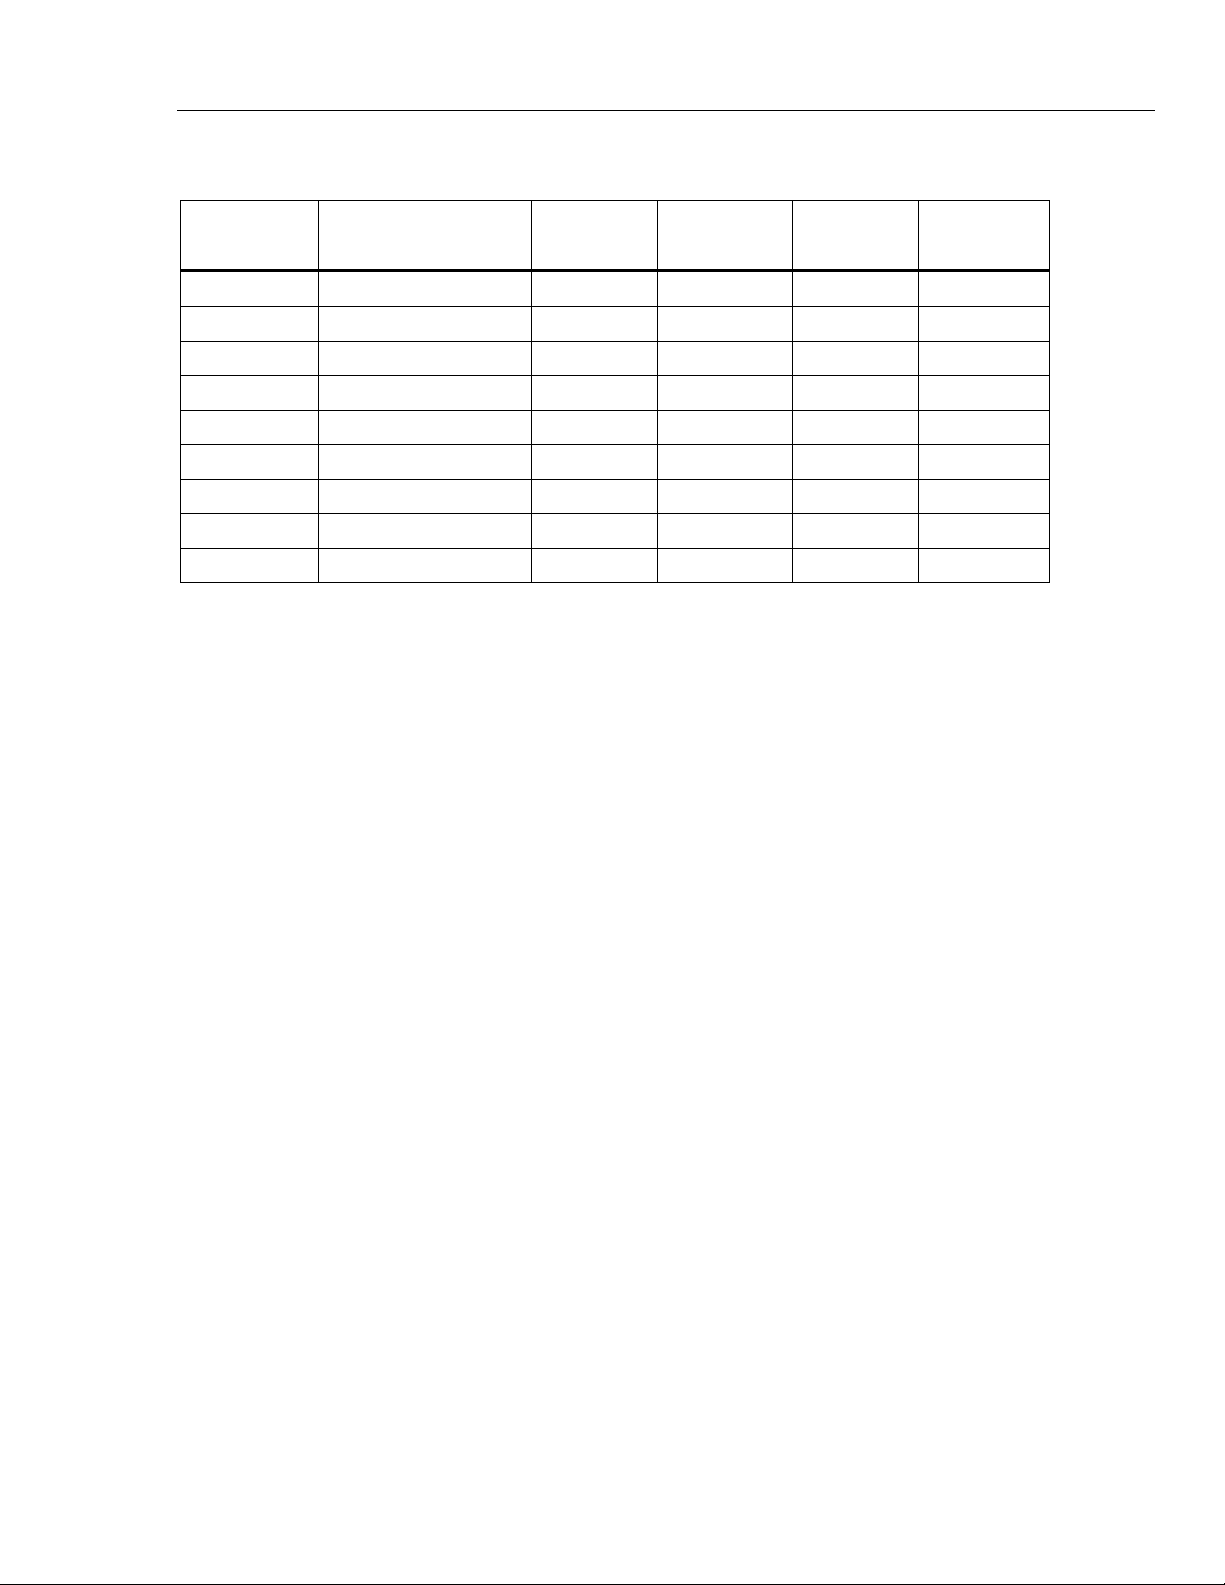
Table 11. Resistance Source Verification Points
UUT Range UUT Output
Minimum
1-Yea
r
Maximum
1-Yea
r
Minimum
2-Yea
r
Maximum
2-Yea
r
10.000 Ω 0.1 Ω 0.0900 0.1100 0.0850 0.1150
10.000 Ω 1 Ω 0.9899 1.0101 0.9849 1.0152
10.000 Ω 10 Ω 9.9890 10.0110 9.9835 10.0165
100.00 Ω 20 Ω 19.978 20.022 19.967 20.033
100.00 Ω 100 Ω 99.970 100.030 99.955 100.045
1000.0 Ω 200 Ω 199.76 200.24 199.64 200.36
1000.0 Ω 1000 Ω 999.60 1000.40 999.40 1000.60
10.000 kΩ 2 kΩ 1.9966 2.0034 1.9944 2.0056
10.000 kΩ 10 kΩ 9.9950 10.0050 9.9920 10.0080
Frequency Source
To verify the frequency source function:
1. Connect the UUT to the Tektronix FCA3000 Counter as shown in Figure 9.
2. Set the UUT to source, frequency, 1.000 Vpp, square wave, at 5 Hz.
3. See if the value shown on the Tektronix FCA3000 is in the range shown in the
applicable column in Table 11
4. Use the Fluke 123 to examine the wave forms. For the square wave, a positive
square wave, with a 50 % duty-cycle (±5 %), and 1.0 V peak amplitude. See that
the amplitude is correct for the applied signal. For the sine wave, make sure you
have the correct frequency, waveform, and amplitude.
5. Continue through the test points. See if the value shown on the UUT is in the
range shown in the applicable column of Table 12.
6. When you complete the test, push on the UUT two times to turn off the
source function. This conserves battery life.