mi17050592.pdf - 第11页
Micromachines 2026 , 17 , 592 11 of 34 3.2. Experimental Characterization 3.2.1. Hyster esis Measurement As described in Section 2 , the piezoelectric actuators in the Eclipse Dynamic system exhibit path-dependent hyster…
Micromachines 2026, 17, 592
10 of 34
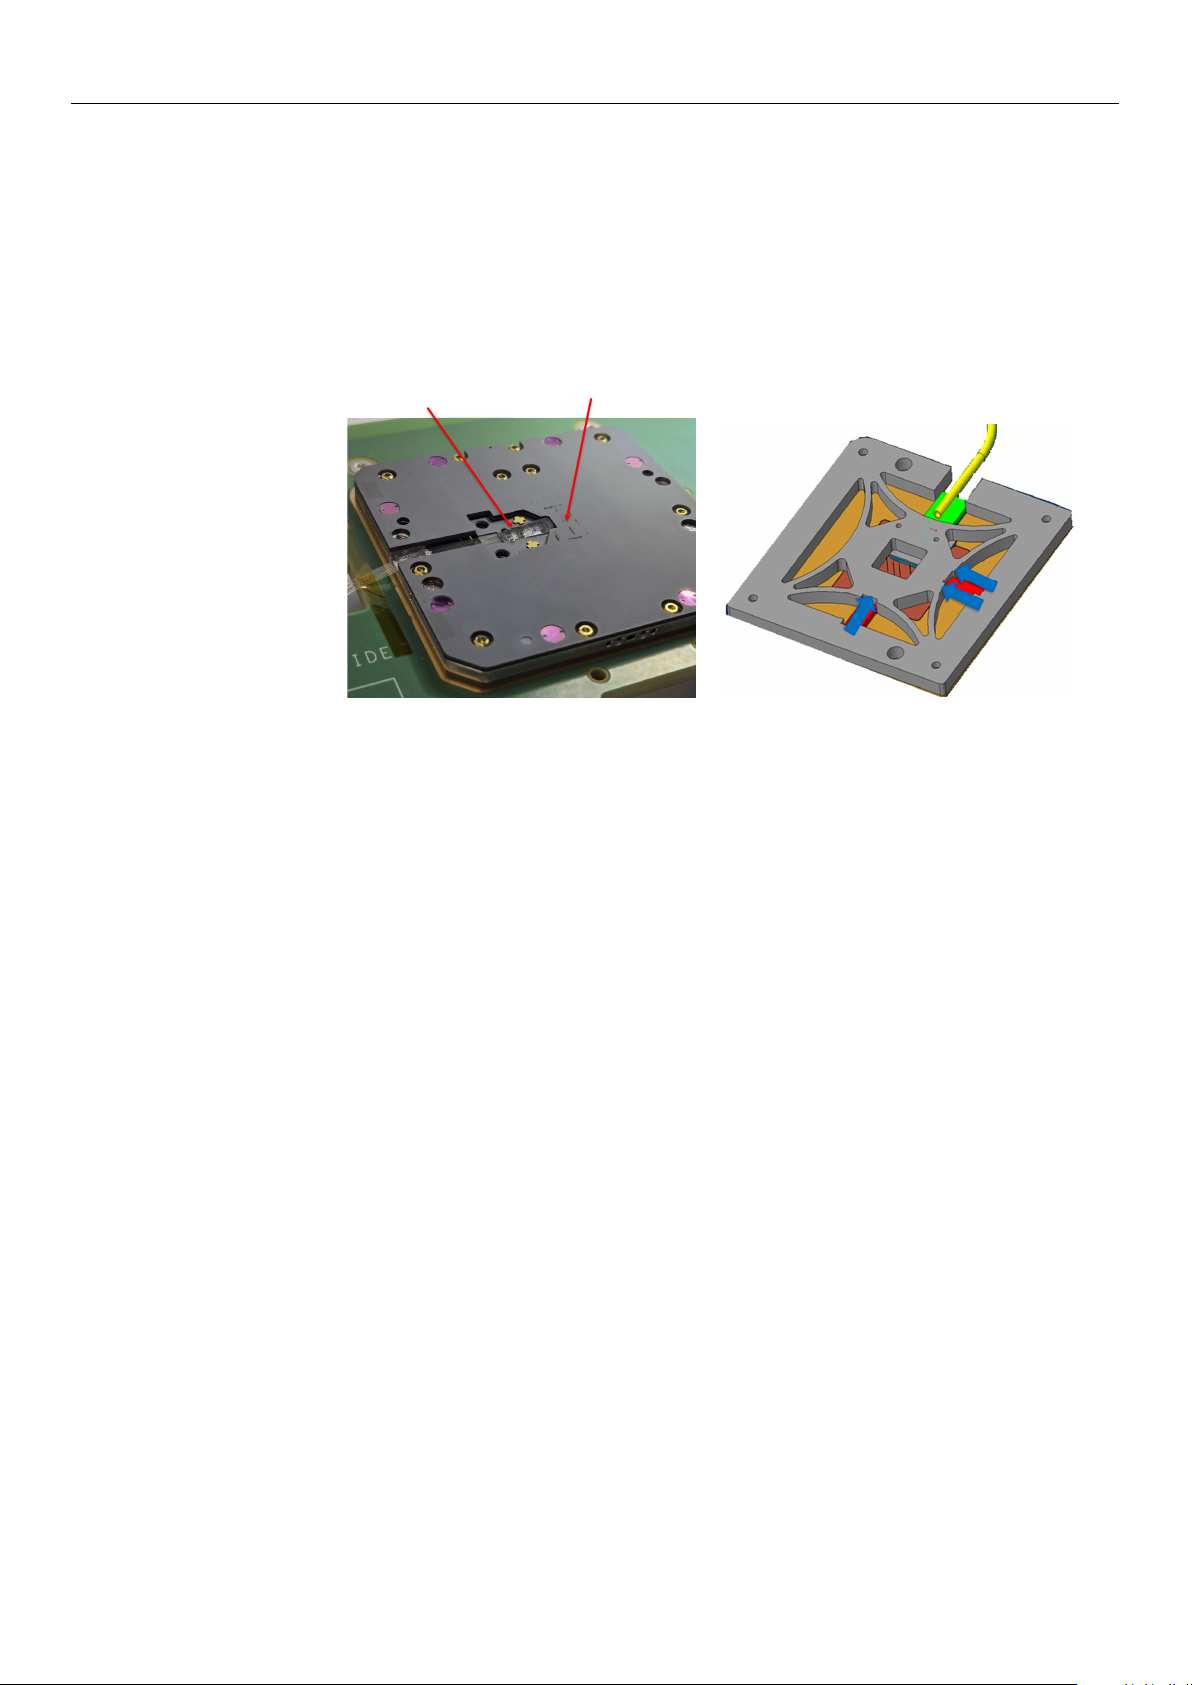
Structurally, the probe head consists of two ceramic layers with guiding holes for
the electrical probes, separated by a metallic flexure structure, as illustrated in Figure 3.
Based on the patented mechanical architecture [
41
], this flexure supports the integrated
FAU and is actuated by three piezoelectric elements: one actuator controls the X-axis, while
two parallel actuators (Y1 and Y2) control the Y-axis. Differential driving of Y1 and Y2
provides the rotational tilt compensation required for precise optical alignment, whereas
the vertical Z-axis approach is handled by the prober chuck rather than by the integrated
piezoelectric stage.
Probes
FAU
(a) (b)
Figure 3. Eclipse Dynamic Probe Head architecture. (a) Complete probe head assembly showing
electrical probes and FAU integration. (b) Internal flexure mechanism showing the piezoelectric
actuators (X, Y1, Y2) used for nanometric alignment, with their respective positions marked in
blue [8].
The embedded FAU is a configurable interface rather than a fixed-format optical array.
In particular, the number of fibers and the fiber pitch are selected according to the PIC
under test, including the number of optical channels, the spacing between input/output
ports, and the pitch of the access couplers or waveguides on the chip. Accordingly, the
FAU geometry is customized to match the DUT layout while remaining compatible with
the mechanical and electrical constraints of the integrated probe head. More generally,
the underlying probe-head concept supports multi-channel optical interfacing through an
optical distribution element comprising a plurality of waveguides aligned to the probe-
head structure by dedicated alignment features [
41
]. Because the input and output fibers
are fixed within one rigid FAU block, they are aligned simultaneously as a unified assembly
rather than sequentially.
The actuators are controlled through the probe card PCB, driven by the tester system.
The operating voltage range is 0–120 V, corresponding to a total displacement range of
15
µ
m
×
15
µ
m in the X–Y plane. Under typical operating conditions, the system achieves
positioning resolution better than 1 nm, enabling precise alignment to grating couplers
with typical mode-field diameters of 10–15 µm.
Because the probe head is a highly compact integrated electro-optical environment,
embedding physical displacement sensors for closed-loop optical alignment would in-
troduce undesirable spatial and packaging complexity. Therefore, the system relies on
open-loop control. Although the complete hardware architecture and containment-element
kinematics have been defined in foundational patents and prior literature [
7
,
8
,
41
], the
remainder of this study focuses specifically on the computational efficiency, reliability, and
optimization of the automated optical alignment algorithms.
https://doi.org/10.3390/mi17050592
Micromachines 2026, 17, 592
11 of 34
3.2. Experimental Characterization
3.2.1. Hysteresis Measurement
As described in Section 2, the piezoelectric actuators in the Eclipse Dynamic system
exhibit path-dependent hysteresis whose magnitude scales with the applied voltage range.
To quantify this behavior for the specific axes and operating conditions of this work, we
performed controlled voltage sweeps on the physical hardware while measuring displace-
ment with a high-resolution optical measurement system. A ceramic reference plate with
precision markers was mounted on the flexure, and displacement was recorded as voltage
was increased and decreased in steps.
The experimental protocol reads as follows. Voltage was swept for each of the three
physical actuators (X, Y1, and Y2) from 0 V to each of six peak levels (20, 40, 60, 80, 100,
and 120 V) and returned to 0 V, with the resulting spatial displacement recorded at every
step. This protocol isolates how hysteresis error scales with the peak operating voltage.
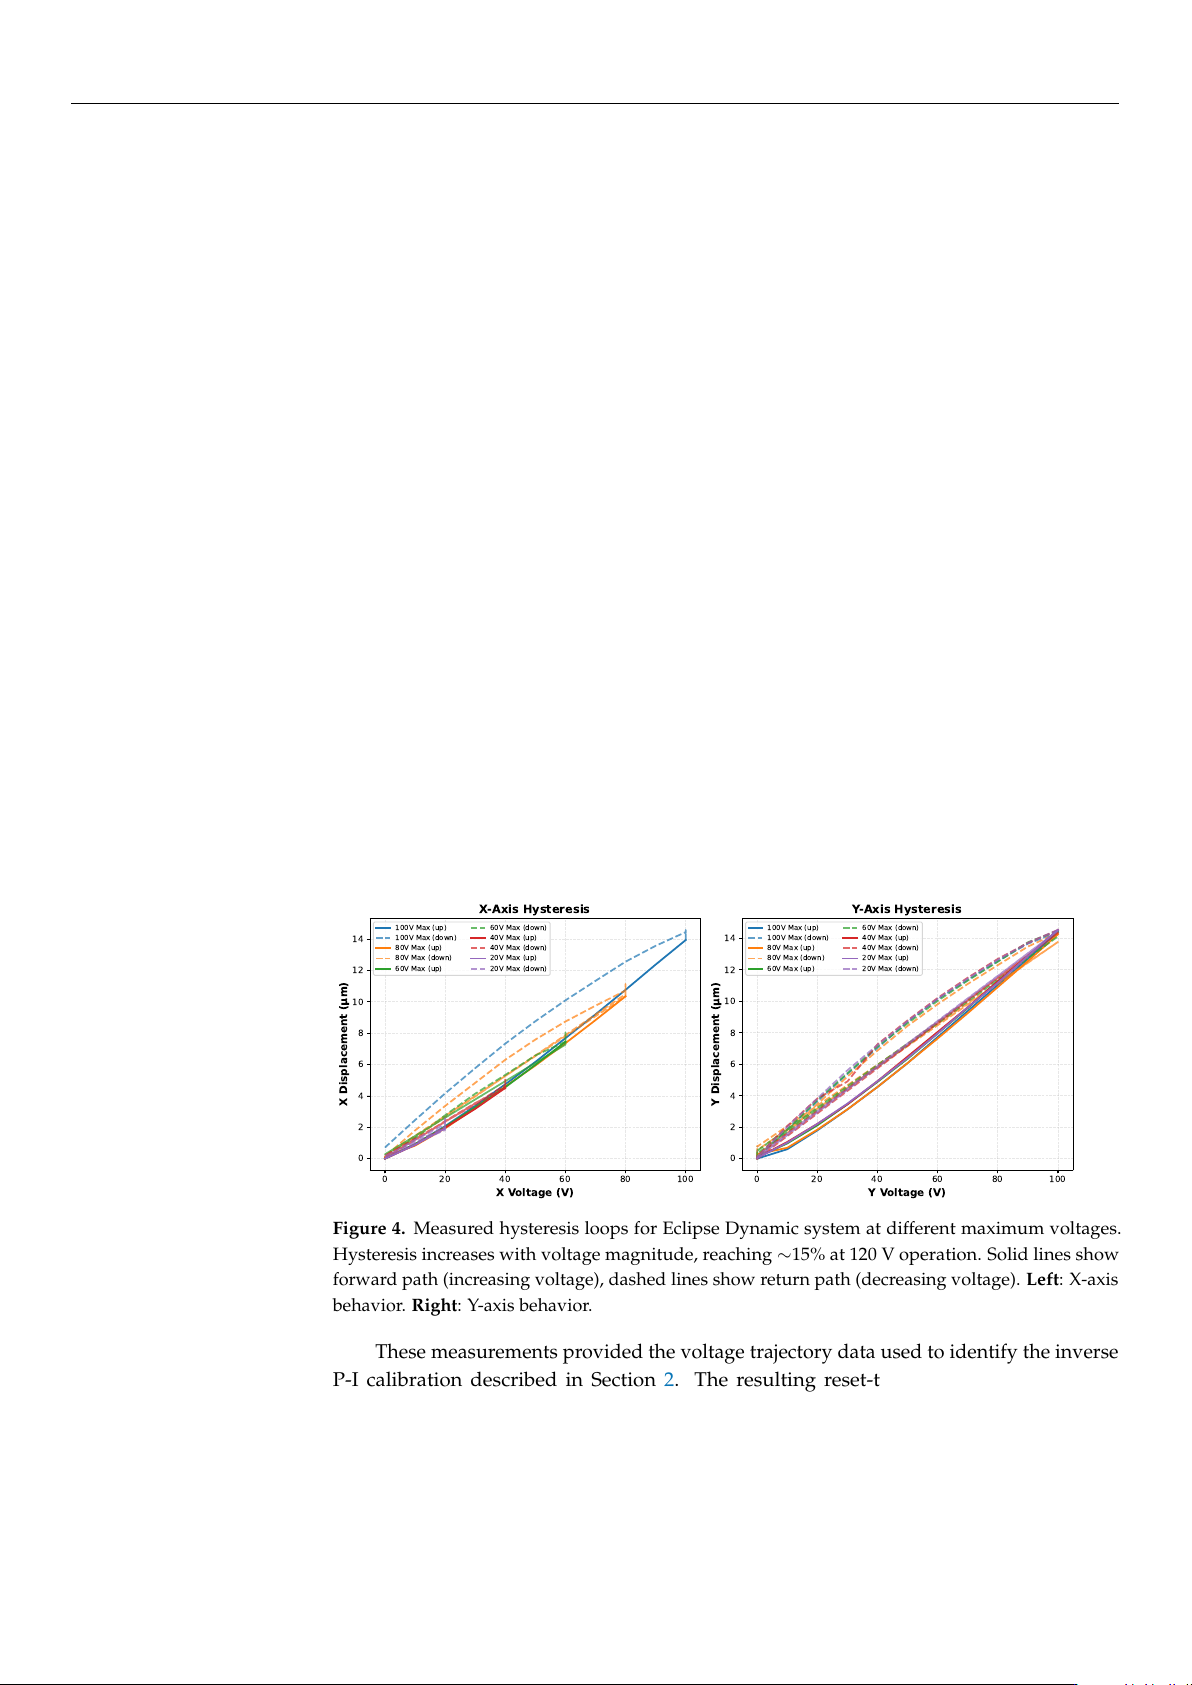
The measured hysteresis loops representing the resulting spatial movement along
the X and Y axes are shown in Figure 4. Three characteristics are directly relevant to the
algorithm design. First, hysteresis is strongly voltage-dependent: at a peak drive of 100 V
the X-axis positioning error is approximately 3.5%, whereas extending to the full 120 V
operating range raises this to approximately 15%. Second, the forward path (increasing
voltage, solid lines) and return path (decreasing voltage, dashed lines) diverge substantially,
with the descending trajectory consistently underreaching the forward-path displacement
at equivalent drive levels. Third, restricting actuation to the 20–40 V range limits hysteresis
to 2–4%, indicating that algorithms operating via small, localized voltage increments will
inherently encounter fewer nonlinearity effects than those requiring wide-range excursions.
We additionally observed a slight non-orthogonality between the X and Y axes, attributed
to asymmetric Y1/Y2 actuator characteristics and their sequential rather than simultaneous
activation; this cross-coupling is accounted for in all alignment algorithm implementations.
0 20 40 60 80 100
X Voltage (V)
0
2
4
6
8
10
12
14
X Displacement ( m)
X-Axis Hysteresis
100V Max (up)
100V Max (down)
80V Max (up)
80V Max (down)
60V Max (up)
60V Max (down)
40V Max (up)
40V Max (down)
20V Max (up)
20V Max (down)
0 20 40 60 80 100
Y Voltage (V)
0
2
4
6
8
10
12
14
Y Displacement ( m)
Y-Axis Hysteresis
100V Max (up)
100V Max (down)
80V Max (up)
80V Max (down)
60V Max (up)
60V Max (down)
40V Max (up)
40V Max (down)
20V Max (up)
20V Max (down)
Figure 4. Measured hysteresis loops for Eclipse Dynamic system at different maximum voltages.
Hysteresis increases with voltage magnitude, reaching
∼
15% at 120 V operation. Solid lines show
forward path (increasing voltage), dashed lines show return path (decreasing voltage). Left: X-axis
behavior. Right: Y-axis behavior.
These measurements provided the voltage trajectory data used to identify the inverse
P-I calibration described in Section 2. The resulting reset-to-zero timing overhead is
captured in the hardware timing model of Section 3.3.4.
3.2.2. Optical Power Measurements
The experimental optical setup is configured to measure insertion loss continuously
during the active alignment process. The apparatus utilizes a continuous-wave laser source
coupled into the single-mode optical fibers of the integrated probe head. Light is injected
https://doi.org/10.3390/mi17050592

Micromachines 2026, 17, 592
12 of 34
into the photonic integrated circuit via an input grating coupler, propagates through a
dedicated on-die optical loopback waveguide, and is subsequently extracted through an
adjacent output grating coupler. The transmitted optical signal is collected by a return fiber
within the array and recorded by a high-speed optical power meter. This continuous data
stream provides the real-time optical power feedback required by the control software to
evaluate coupling efficiency and direct the piezoelectric actuators.
Utilizing this loopback configuration, eight distinct experimental alignment campaigns
were conducted across various grating coupler positions and individual dies. This exper-
imental design comprehensively captures the variability arising from die-to-die process
fluctuations and position-dependent spatial non-uniformities across the wafer. Further-
more, repeated measurements on a single die provide critical insight into overall system
repeatability and environmental stability. Each experimental campaign thus serves as
a highly realistic test case for evaluating algorithm robustness under authentic produc-
tion conditions.
The initial physical measurements were executed using baseline algorithm param-
eters. During this phase, the BO algorithms employed conservative settings: the Global
Bayesian method used 8 initial Latin-Hypercube sampled points [
42
] and a maximum of
70 iterations, while gradient-based methods used moderate, non-adaptive step sizes and
learning rates. These initial parameters, while functional, were not yet optimized for the
specific characteristics of the Eclipse Dynamic system or the optical coupling landscape
topology observed in practice. The experimental results presented in Section 4 therefore
reflect this initial algorithm configuration.
In the updated version of the alignment algorithms used for the comprehensive
simulation study, the methods were refined to maximize both efficiency and reliability.
Specifically, the gradient-based approaches were upgraded with adaptive step sizes and
finer convergence logic to better leverage the system 1 nm hardware positioning resolu-
tion. All detailed mathematical parameters and control logic for these refined algorithms,
including the specific adaptive formulations, are fully explained in Section 3.4. The sim-
ulation framework and the definitive results reported in Section 4 employ these refined,
production-ready configurations. By testing these optimized algorithms across 72 unique
spatial windows representing a 9
×
increase in scenario diversity compared to the initial
experiments, we established the final performance rankings and recommendations for
high-volume PIC manufacturing.
3.3. Simulation Framework
To enable systematic evaluation across a wider range of conditions, we developed a
simulation framework that generates synthetic alignment scenarios from experimental data.
The objective is to validate algorithm performance without requiring physical hardware
by creating high-resolution ground-truth surfaces from discrete measurement data, and
generating mock data files that mimic the limited field of view of the hardware during
operation. Figure 5 summarizes the simulation pipeline used in this work. Starting from
each experimental scan, we reconstruct a continuous ground-truth coupling surface via
Radial Basis Function (RBF) interpolation, to establish an extrapolated 240 V
×
240 V virtual
domain, from which we generate multiple mock scenarios by extracting 120 V
×
120 V
sub-windows at systematic offsets. For each mock scenario, the alignment algorithms are
executed and their recorded trajectories are converted to alignment time using the hardware
timing model. This approach allows for direct comparison across four distinct operating
regimes without requiring additional wafer measurements: low-speed (LS) and high-speed
(HS) actuation, each evaluated with (H) and without (NH) hysteresis compensation, to
provide LS-H, HS-H, LS-NH, and HS-NH scenarios.
https://doi.org/10.3390/mi17050592