mi17050592.pdf - 第22页
Micromachines 2026 , 17 , 592 22 of 34 T o rigorously account for this non-normal distribution of convergence steps, particu- larly as the number of test scenarios increases, we employ data profiles [ 40 ]. A data profile …
Micromachines 2026, 17, 592
21 of 34
(c) Cross (d) Local BO
(e) Global BO (f) Var-Grad
(g) Fix-Grad
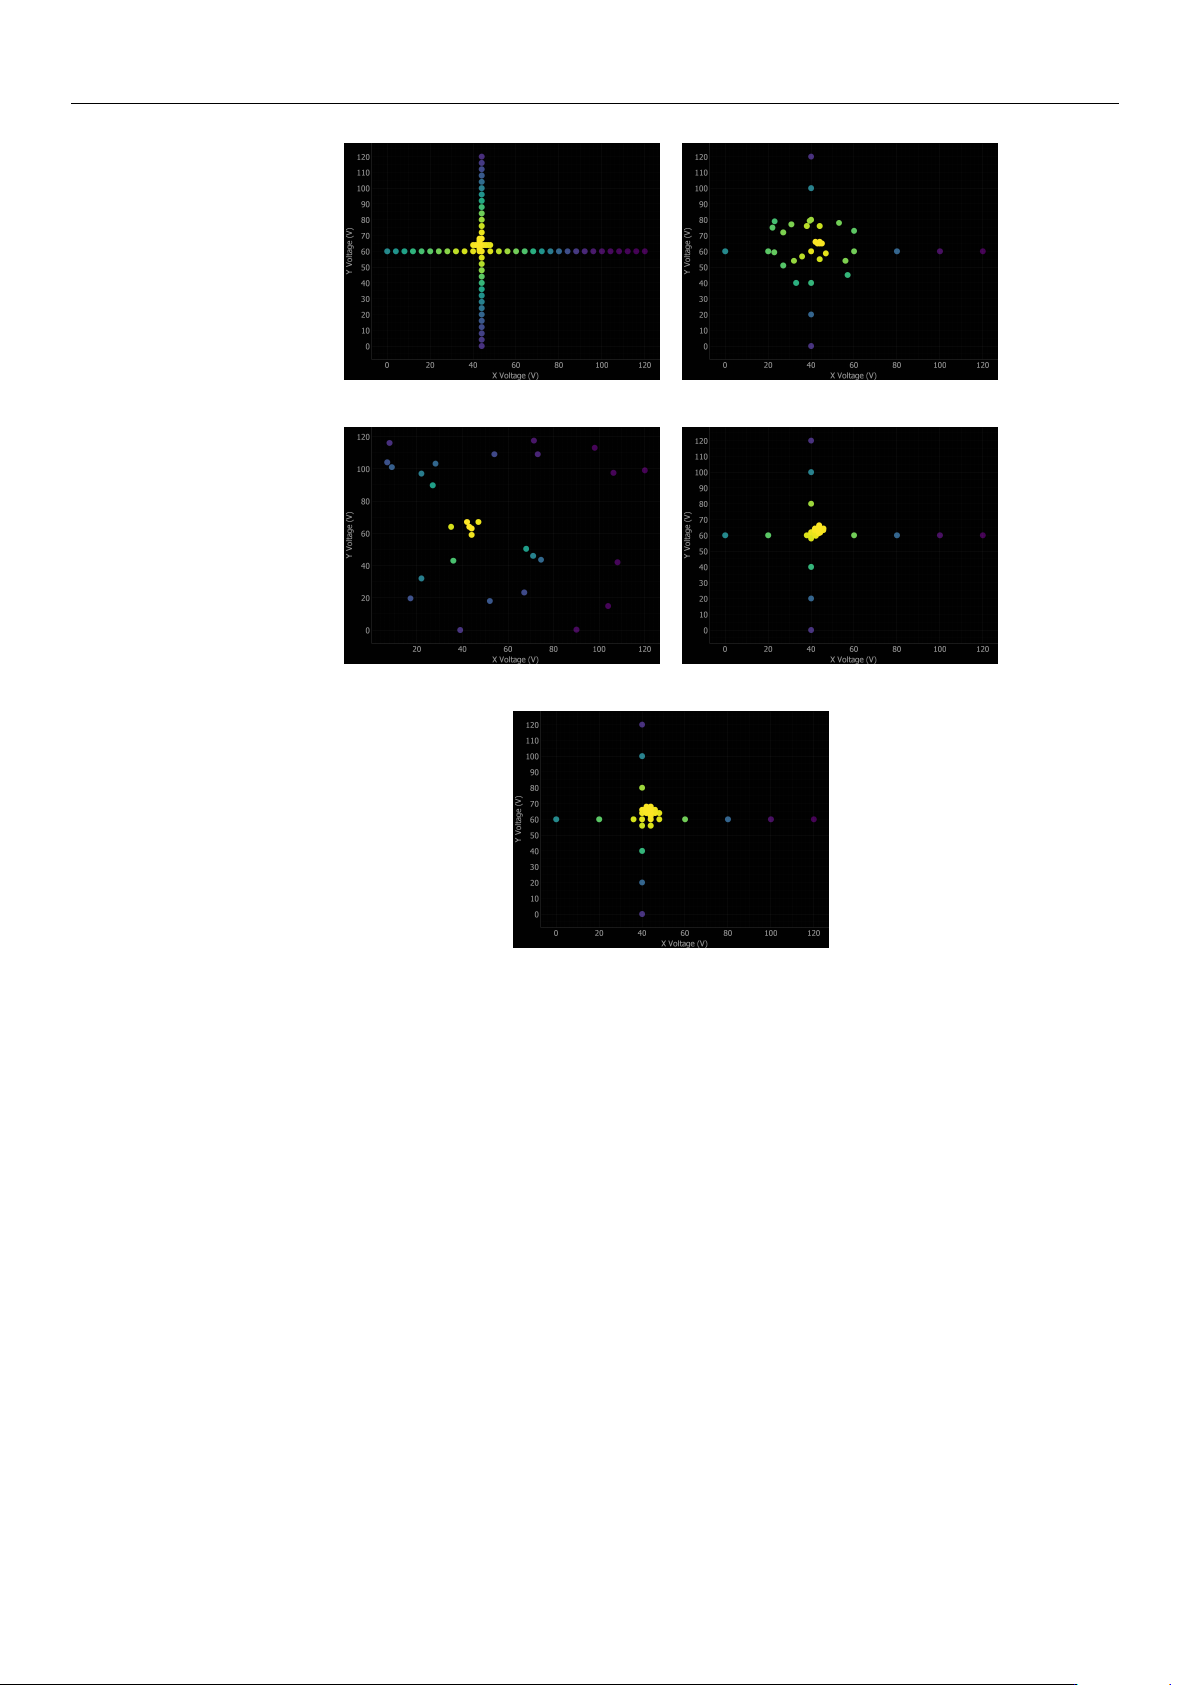
Figure 8. Comparison of all seven alignment algorithms on the same mock scan scenario. Each
panel shows the search path of the algorithm overlaid as discrete colored measurement points,
where the color intensity represents the measured optical power (ranging from dark purple for low
power to bright yellow for the highest power). The figures demonstrate distinct search strategies:
(a,b) exhaustive raster scanning, (c) dimensional reduction, (d,e) BO with intelligent sampling,
(f,g) gradient-based hill climbing.
3.5. Performance Metrics and Statistical Analysis
Following best practices for algorithm comparison [
18
], we employ multiple evalua-
tion approaches to ensure a robust assessment. First, for each algorithm on each problem
instance, we record four individual metrics: a binary success indicator (defined as converg-
ing to
≥
95% of the global maximum), the total number of measurement steps required,
the total elapsed time including all movements and settling delays, and the final coupling
accuracy (the achieved power divided by the global maximum power).
For the initial performance assessment, we compute a core set of aggregate quantitative
indicators. The primary metric is the overall success rate, strictly defined as the percentage
of alignment problems that were resolved successfully. Furthermore, we calculate central
tendency metrics across all trials—specifically the mean number of alignment steps, total
execution time, and final coupling accuracy. It should be noted that when reporting these
average values, appropriate statistical caveats must be applied to account for the frequently
non-normal distributions inherent in optimization data.
https://doi.org/10.3390/mi17050592

Micromachines 2026, 17, 592
22 of 34
To rigorously account for this non-normal distribution of convergence steps, particu-
larly as the number of test scenarios increases, we employ data profiles [
40
]. A data profile
plots the fraction of problems solved as a function of the number of function evaluations
(measurement steps):
ρ
s
(k) =
1
|P|
|{p ∈ P : n
s,p
≤ k}| (6)
where
P
is the set of test problems,
s
is a solver (algorithm),
n
s,p
is the number of steps
required by solver
s
on problem
p
, and
k
is the step budget. Data profiles provide a
complete picture of algorithm performance by showing not just average behavior, but the
full distribution of convergence speeds. An algorithm with a steep data profile quickly
solves most problems, while a shallow profile indicates slower or less reliable convergence.
In this work, data profiles are generated for the experimental results and for each specific
simulation scenario (HS-H, HS-NH, LS-H, and LS-NH), enabling a comprehensive statistical
comparison of algorithm performance across all operating conditions.
4. Results
4.1. Experimental Results
The algorithms are ranked based on a composite evaluation considering four critical
metrics: (1) success rate, which is the primary criterion for production deployment; (2) av-
erage alignment time, reflecting throughput impact; (3) final accuracy, indicating optical
coupling quality; and (4) average number of steps, representing measurement efficiency.
Algorithms with 100% success rate are prioritized, then ranked by alignment time. Those
with lower success rates are ranked lower regardless of speed, as unreliable alignment
requires manual intervention and severely impacts production throughput.
Table 1 summarizes the performance of all seven algorithms across the eight experi-
mental coupling scenarios.
Table 1. Experimental alignment results across 8 coupling scenarios. Algorithms ranked by combined
performance considering success rate, time, accuracy, and measurement efficiency. Results obtained
with baseline algorithm parameters.
Rank Method Success Rate Avg Time (a.u.) Avg Accuracy (%) Avg Steps
1 Local BO 100% 99.87 98.24 26.5
2 Fix-Grad 100% 154.01 99.18 69.0
3 Global BO 87.5% 175.19 97.60 37.4
4 Ref-Coarse+Fine 87.5% 334.11 98.31 600.3
5 Cross 75.0% 36.63 96.84 80.0
6 Var-Grad 75.0% 59.28 95.99 22.5
7 Ref-Coarse 75.0% 410.90 96.81 961.0
Experimental results indicate that the Local BO method achieves superior overall
performance, delivering a 100% success rate, 98.24% accuracy, and rapid convergence
(26.5 steps, 99.87 a.u.). This hybrid approach successfully balances exploration and ex-
ploitation via cross-scan initialization followed by Bayesian refinement. The Fix-Grad
algorithm similarly achieves absolute reliability (100% success) alongside a marginally
higher accuracy of 99.18%, although its systematic neighborhood exploration demands
increased execution metrics (69.0 steps, 154.01 a.u.). In contrast, Global BO demonstrates
strong general performance (97.60% accuracy, 37.4 steps) but yields an 87.5% success rate,
indicating occasional difficulty navigating complex landscapes where optimal coupling re-
gions remain distant from initial random samples. Furthermore, while the Ref-Coarse+Fine
strategy provides adequate accuracy (98.31%), the exhaustive measurement requirement
https://doi.org/10.3390/mi17050592
Micromachines 2026, 17, 592
23 of 34
(600.3 steps, 334.11 a.u.) renders the approach entirely impractical for high-throughput
manufacturing. The remaining techniques, that are Cross, Var-Grad, and Reference Coarse,
exhibit heightened sensitivity to landscape topology, peaking at a 75% success rate. No-
tably, Var-Grad operates with the highest speed (22.5 steps, 59.28 a.u.) but lacks requisite
dependability. Consequently, Local BO presents the optimal synthesis of speed, accuracy,
and reliability for physical alignment tasks. Securing a 100% success rate is paramount
for strict production environments to eliminate manual intervention and preserve critical
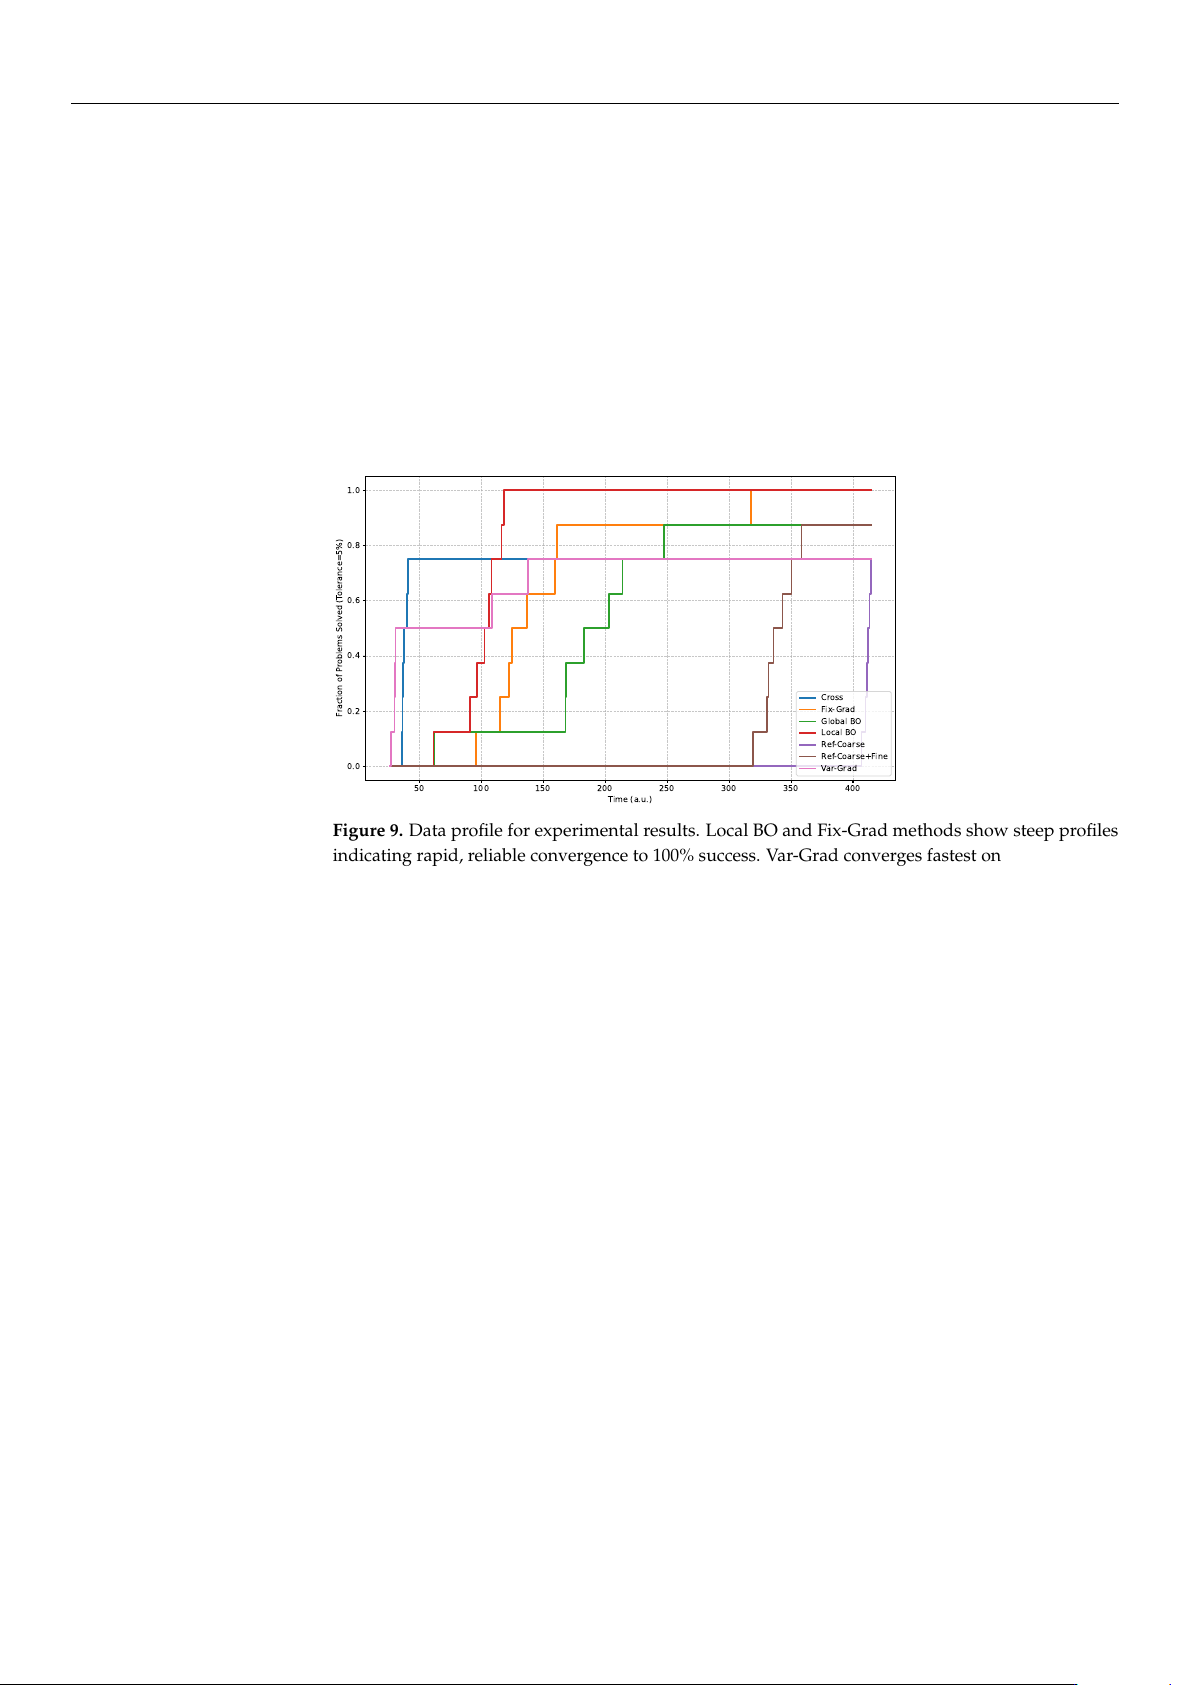
operational throughput. Figure 9 shows the data profile for experimental results, plotting
the fraction of problems solved as a function of total alignment time. The discrete, step-like
appearance of these profiles is simply a consequence of the limited experimental sample
size (N = 8).
50 100 150 200 250 300 350 400
Time (a.u.)
0.0
0.2
0.4
0.6
0.8
1.0
Fraction of Problems Solved (Tolerance=5%)
Cross
Fix-Grad
Global BO
Local BO
Ref-Coarse
Ref-Coarse+Fine
Var-Grad
Figure 9. Data profile for experimental results. Local BO and Fix-Grad methods show steep profiles
indicating rapid, reliable convergence to 100% success. Var-Grad converges fastest on easy problems
but plateaus at 75%, while Ref-Coarse/Ref-Coarse+Fine require many measurements.
Following the methodology of Beiranvand et al. [
18
], data profile analysis elucidates
comprehensive convergence behaviors that simple central tendency metrics obscure. Specif-
ically, the Local BO profile exhibits a steep initial trajectory, achieving 100% success rate
within approximately 30 steps. The Fix-Grad method similarly reaches absolute reliability
by 80 steps, demonstrating a steady, albeit slower, progression. Conversely, algorithms
such as Global BO, Var-Grad, and Cross exhibit rapid initial climbs but prematurely plateau
at success rates of 87.5%, 75%, and 75%, respectively, indicating fundamental failure cases.
Moreover, the exhaustive reference techniques Ref-Coarse and Ref-Coarse+Fine require
hundreds of measurements merely to attain sub-optimal success rates between 75% and
87.5%. Ultimately, this statistical visualization demonstrates that while Var-Grad yields
the lowest average step count (22.5), its early performance plateau and 25% failure rate
render it significantly inferior to the robust Local BO and Fix-Grad algorithms for rigorous
production deployment.
4.2. Simulation Results
Table 2 summarizes the average number of measurement steps required by each
algorithm across the four simulation scenarios. Results are averaged over multiple mock
files generated from the experimental data. Global BO requires the fewest steps (
∼
25),
followed closely by Var-Grad (
∼
26) and Local BO (
∼
31). The intelligent sampling of
Bayesian and Gradient methods reduces the measurement burden by over 20
×
compared
to Ref-Coarse+Fine scanning (540 steps). The step counts are independent of the operating
scenario, as they reflect algorithmic logic rather than timing. However, these step counts
directly impact total time, which varies significantly across scenarios as shown next.
https://doi.org/10.3390/mi17050592