mi17050592.pdf - 第24页
Micromachines 2026 , 17 , 592 24 of 34 T able 2. A verage number of measurement steps. Algorithm HS-H HS-NH LS-H LS-NH Ref-Coarse 961.0 961.0 961.0 961.0 Ref-Coarse+Fine 539.6 539.6 539.6 539.6 Cross Scan 75.6 75.6 75.6 …
Micromachines 2026, 17, 592
23 of 34
(600.3 steps, 334.11 a.u.) renders the approach entirely impractical for high-throughput
manufacturing. The remaining techniques, that are Cross, Var-Grad, and Reference Coarse,
exhibit heightened sensitivity to landscape topology, peaking at a 75% success rate. No-
tably, Var-Grad operates with the highest speed (22.5 steps, 59.28 a.u.) but lacks requisite
dependability. Consequently, Local BO presents the optimal synthesis of speed, accuracy,
and reliability for physical alignment tasks. Securing a 100% success rate is paramount
for strict production environments to eliminate manual intervention and preserve critical
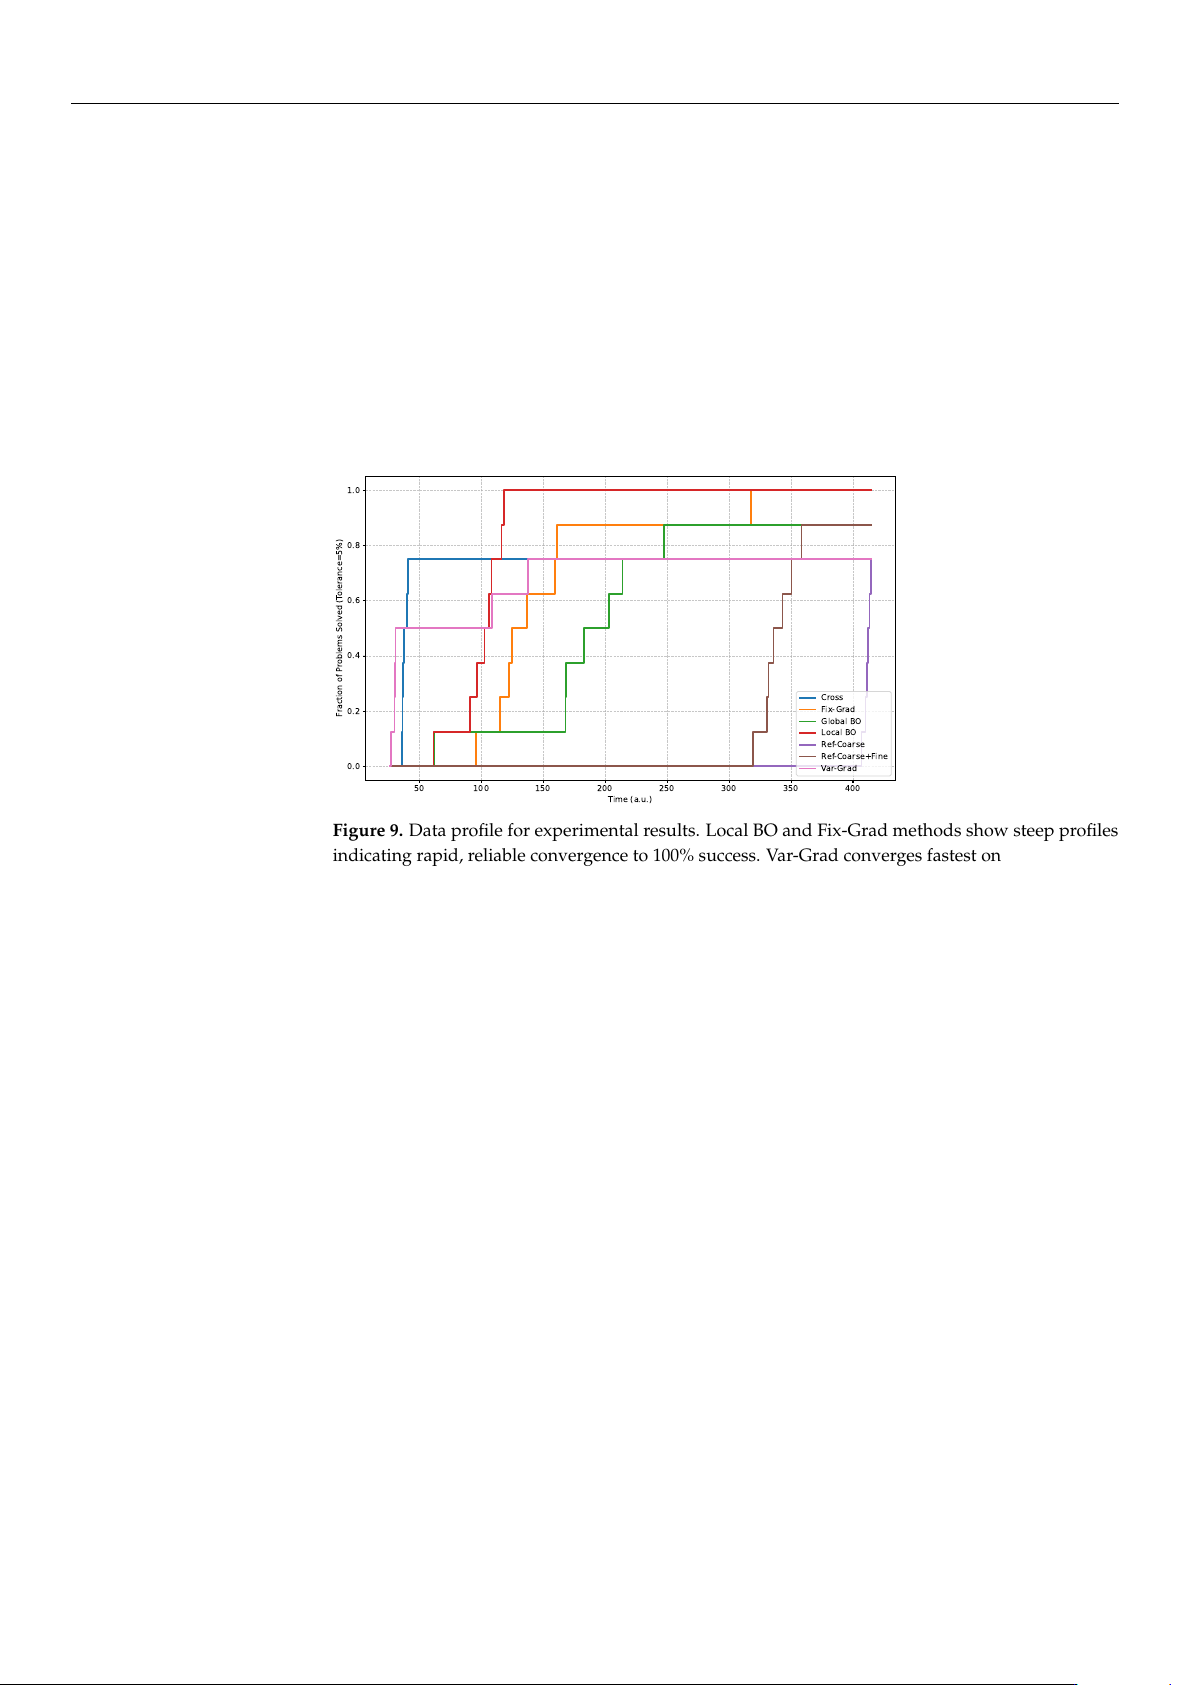
operational throughput. Figure 9 shows the data profile for experimental results, plotting
the fraction of problems solved as a function of total alignment time. The discrete, step-like
appearance of these profiles is simply a consequence of the limited experimental sample
size (N = 8).
50 100 150 200 250 300 350 400
Time (a.u.)
0.0
0.2
0.4
0.6
0.8
1.0
Fraction of Problems Solved (Tolerance=5%)
Cross
Fix-Grad
Global BO
Local BO
Ref-Coarse
Ref-Coarse+Fine
Var-Grad
Figure 9. Data profile for experimental results. Local BO and Fix-Grad methods show steep profiles
indicating rapid, reliable convergence to 100% success. Var-Grad converges fastest on easy problems
but plateaus at 75%, while Ref-Coarse/Ref-Coarse+Fine require many measurements.
Following the methodology of Beiranvand et al. [
18
], data profile analysis elucidates
comprehensive convergence behaviors that simple central tendency metrics obscure. Specif-
ically, the Local BO profile exhibits a steep initial trajectory, achieving 100% success rate
within approximately 30 steps. The Fix-Grad method similarly reaches absolute reliability
by 80 steps, demonstrating a steady, albeit slower, progression. Conversely, algorithms
such as Global BO, Var-Grad, and Cross exhibit rapid initial climbs but prematurely plateau
at success rates of 87.5%, 75%, and 75%, respectively, indicating fundamental failure cases.
Moreover, the exhaustive reference techniques Ref-Coarse and Ref-Coarse+Fine require
hundreds of measurements merely to attain sub-optimal success rates between 75% and
87.5%. Ultimately, this statistical visualization demonstrates that while Var-Grad yields
the lowest average step count (22.5), its early performance plateau and 25% failure rate
render it significantly inferior to the robust Local BO and Fix-Grad algorithms for rigorous
production deployment.
4.2. Simulation Results
Table 2 summarizes the average number of measurement steps required by each
algorithm across the four simulation scenarios. Results are averaged over multiple mock
files generated from the experimental data. Global BO requires the fewest steps (
∼
25),
followed closely by Var-Grad (
∼
26) and Local BO (
∼
31). The intelligent sampling of
Bayesian and Gradient methods reduces the measurement burden by over 20
×
compared
to Ref-Coarse+Fine scanning (540 steps). The step counts are independent of the operating
scenario, as they reflect algorithmic logic rather than timing. However, these step counts
directly impact total time, which varies significantly across scenarios as shown next.
https://doi.org/10.3390/mi17050592

Micromachines 2026, 17, 592
24 of 34
Table 2. Average number of measurement steps.
Algorithm HS-H HS-NH LS-H LS-NH
Ref-Coarse 961.0 961.0 961.0 961.0
Ref-Coarse+Fine 539.6 539.6 539.6 539.6
Cross Scan 75.6 75.6 75.6 75.6
Local BO 30.7 31.3 31.2 30.9
Global BO 24.6 24.7 23.9 24.6
Var-Grad 26.1 26.1 26.1 26.1
Fix-Grad 34.4 34.4 34.4 34.4
Table 3 shows total alignment time including movement and settling delays. Here, op-
erating speed and hysteresis effects become apparent. The experimental data highlight the
substantial throughput advantages of high-speed actuation. Transitioning from low-speed
to high-speed regimes yields a roughly 24-fold acceleration for the Global BO algorithm,
reducing alignment time from 53.06 to 2.24 a.u. under non-hysteretic conditions (HS-NH).
However, managing uncompensated hysteresis introduces severe temporal overhead due
to mandatory reset-to-zero motions, which inflates Global BO execution times by approx-
imately 92% (from 2.24 to 4.29 a.u. in HS-H). Among the evaluated methods, Var-Grad
achieves the absolute fastest alignment at 1.18 a.u. (HS-NH), although subsequent analysis
reveals this speed incurs a significant reliability penalty. Conversely, Fix-Grad maintains
a highly competitive balance, completing alignments in 1.44 a.u. (HS-NH) and 3.32 a.u.
(HS-H) to offer a rapid, dependable alternative to Bayesian approaches.
Table 3. Average total alignment time (a.u.).
Algorithm HS-H HS-NH LS-H LS-NH
Ref-Coarse 33.39 30.64 382.60 315.01
Ref-Coarse+Fine 21.26 18.10 286.07 205.53
Cross Scan 2.88 2.44 35.42 24.88
Local BO 3.60 1.54 85.29 26.63
Global BO 4.29 2.24 103.26 53.06
Var-Grad 2.39 1.18 51.00 18.97
Fix-Grad 3.32 1.44 72.47 20.95
Finally, to evaluate overall optimization quality and robustness, Table 4 details the
achieved optical power as a percentage of the global maximum. Simulation results highlight
the superior precision of the Fix-Grad method, which consistently achieves 99.4% of the
global maximum power. Global BO and Local BO also perform excellently, achieving
around 98% accuracy. Var-Grad shows improved accuracy compared to initial tests (98%),
making it a competitive high-speed option.
Table 4. Average final power coupling (% of global maximum).
Algorithm HS-H HS-NH LS-H LS-NH
Ref-Coarse 99.9 99.9 99.9 99.9
Ref-Coarse+Fine 100.0 100.0 100.0 100.0
Cross Scan 98.2 98.2 98.2 98.2
Local BO 98.2 98.3 98.3 98.3
Global BO 98.2 98.0 97.9 98.4
Var-Grad 98.0 98.0 98.0 98.0
Fix-Grad 99.4 99.4 99.4 99.4
https://doi.org/10.3390/mi17050592
Micromachines 2026, 17, 592
25 of 34
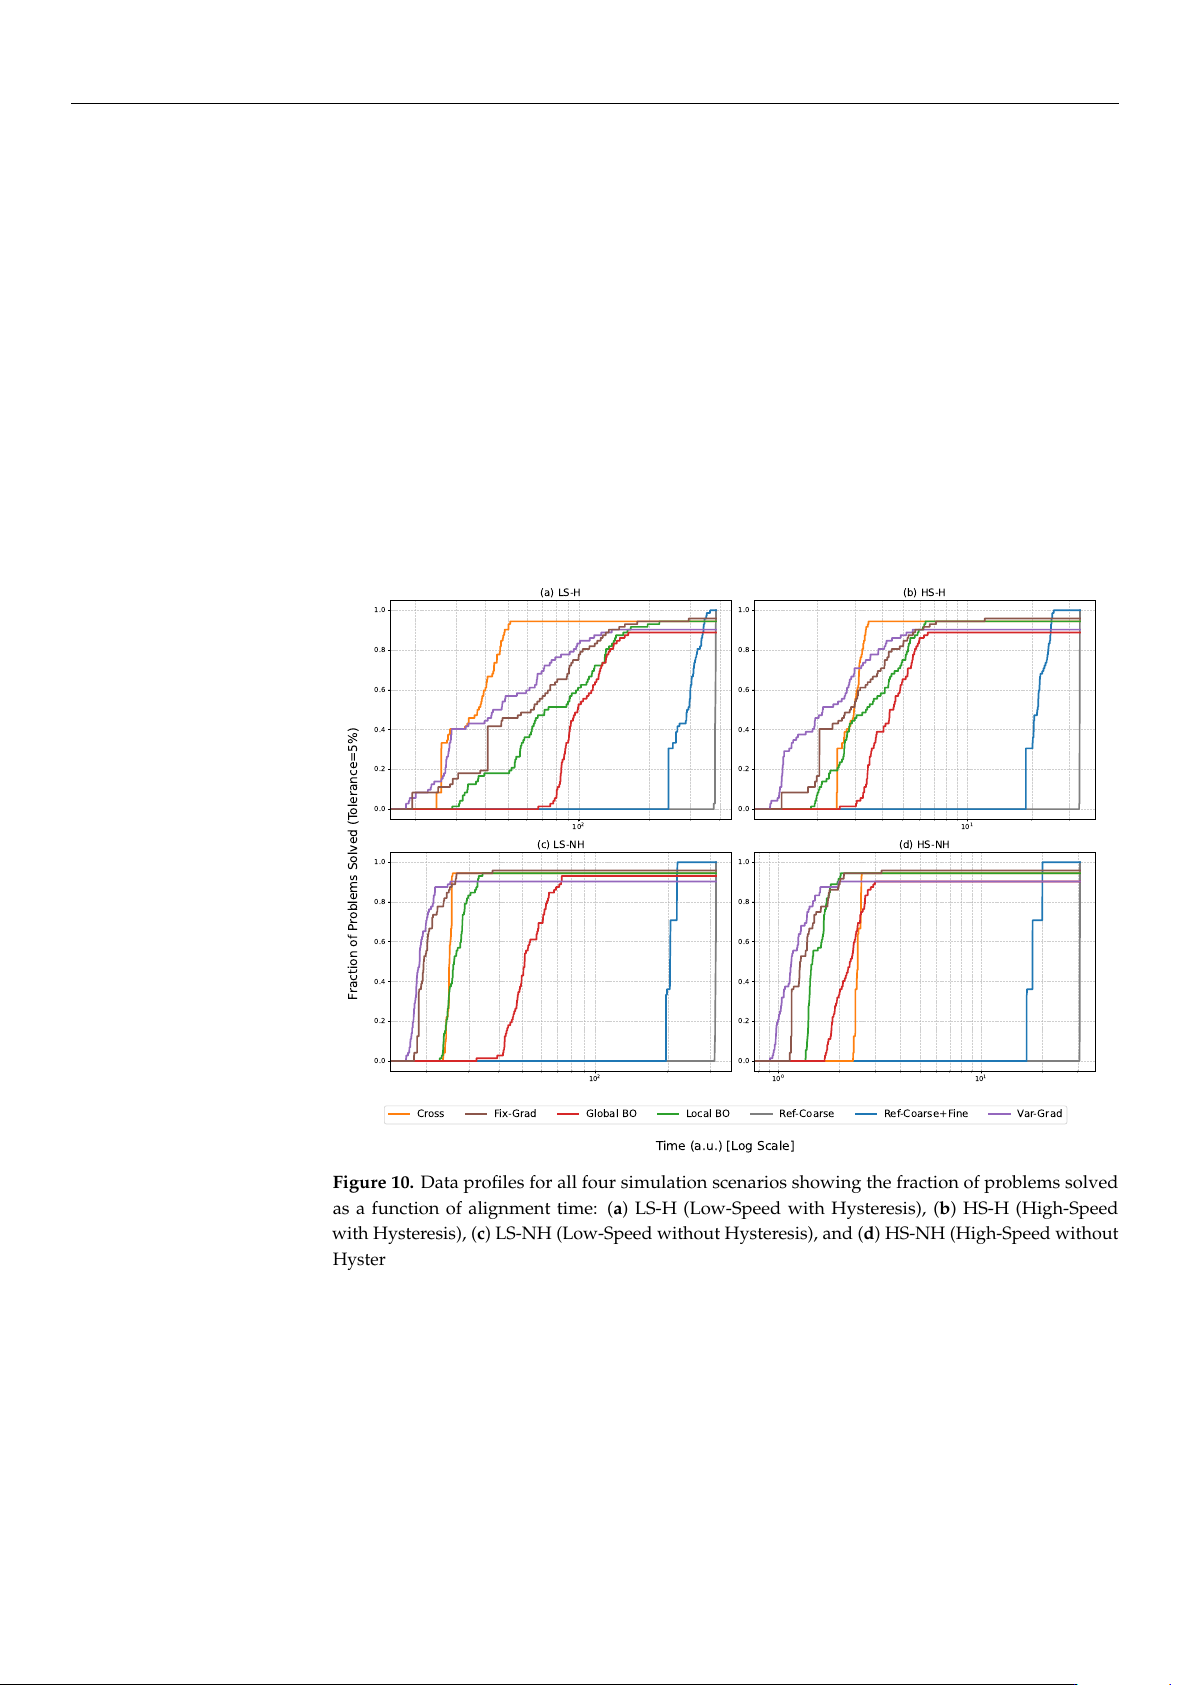
The performance of the seven investigated algorithms was evaluated across the 72 sim-
ulated test cases derived from experimental data. We utilize data profiles to represent the
fraction of problems solved as a function of the total alignment time. A solved problem
is defined as achieving a coupling power within 5% of the global maximum. Figure 10
illustrates these profiles across the four operating regimes. Figure 10b illustrates algorithm
performance under realistic high-speed conditions with active hysteresis effects (HS-H).
The Fix-Grad algorithm demonstrates the highest reliability (95.8%) across all 72 simulated
test cases in the HS-H regime. Local BO and Global BO are competitive but exhibit lower fi-
nal success rates (94.4% and 88.9%, respectively). Furthermore, while the Var-Grad method
shows the fastest initial convergence for simple scenarios, solving a significant fraction of
cases in under 2.6 a.u., it fails to achieve absolute reliability, plateauing at a 90.3% success
rate due to its inherent sensitivity to hysteresis-induced local maxima. This highlights
the robust advantage of the deterministic Fix-Grad approach, which maintains superior
accuracy and dependability even when the mandatory reset-to-zero strategy introduces
movement overhead to compensate for piezoelectric nonlinearities.
10
2
0.0
0.2
0.4
0.6
0.8
1.0
(a) LS-H
10
1
0.0
0.2
0.4
0.6
0.8
1.0
(b) HS-H
10
2
0.0
0.2
0.4
0.6
0.8
1.0
(c) LS-NH
10
0
10
1
0.0
0.2
0.4
0.6
0.8
1.0
(d) HS-NH
Time (a.u.) [Log Scale]
Fraction of Problems Solved (Tolerance=5%)
Cross Fix-Grad Global BO Local BO Ref-Coarse Ref-Coarse+Fine Var-Grad
Figure 10. Data profiles for all four simulation scenarios showing the fraction of problems solved
as a function of alignment time: (a) LS-H (Low-Speed with Hysteresis), (b) HS-H (High-Speed
with Hysteresis), (c) LS-NH (Low-Speed without Hysteresis), and (d) HS-NH (High-Speed without
Hysteresis). Note that the time axis is logarithmic to clearly visualize the significant speed advantage
of active alignment methods (<5.1 a.u.) over exhaustive reference scans (>257.1 a.u.). Fix-Grad
achieves the highest and most consistent reliability (95.8%) across all scenarios, while Global BO
shows scenario-dependent reliability (88.9–93.1%) and Var-Grad shows the fastest initial convergence
but lower final reliability (90.3%).
Comparing Figure 10b–d (HS-NH), the removal of hysteresis effects results in a left-
ward shift of the performance curves, reducing absolute alignment time by approximately
50–57% for gradient and Bayesian methods, consistent with the figures reported in Table 3.
However, the relative performance ranking remains unchanged. This suggests that while
hysteresis imposes a time penalty, the probabilistic nature of the Bayesian methods inher-
ently manages these non-linearities more effectively than pure hill-climbing approaches.
https://doi.org/10.3390/mi17050592