mi17050592.pdf - 第13页
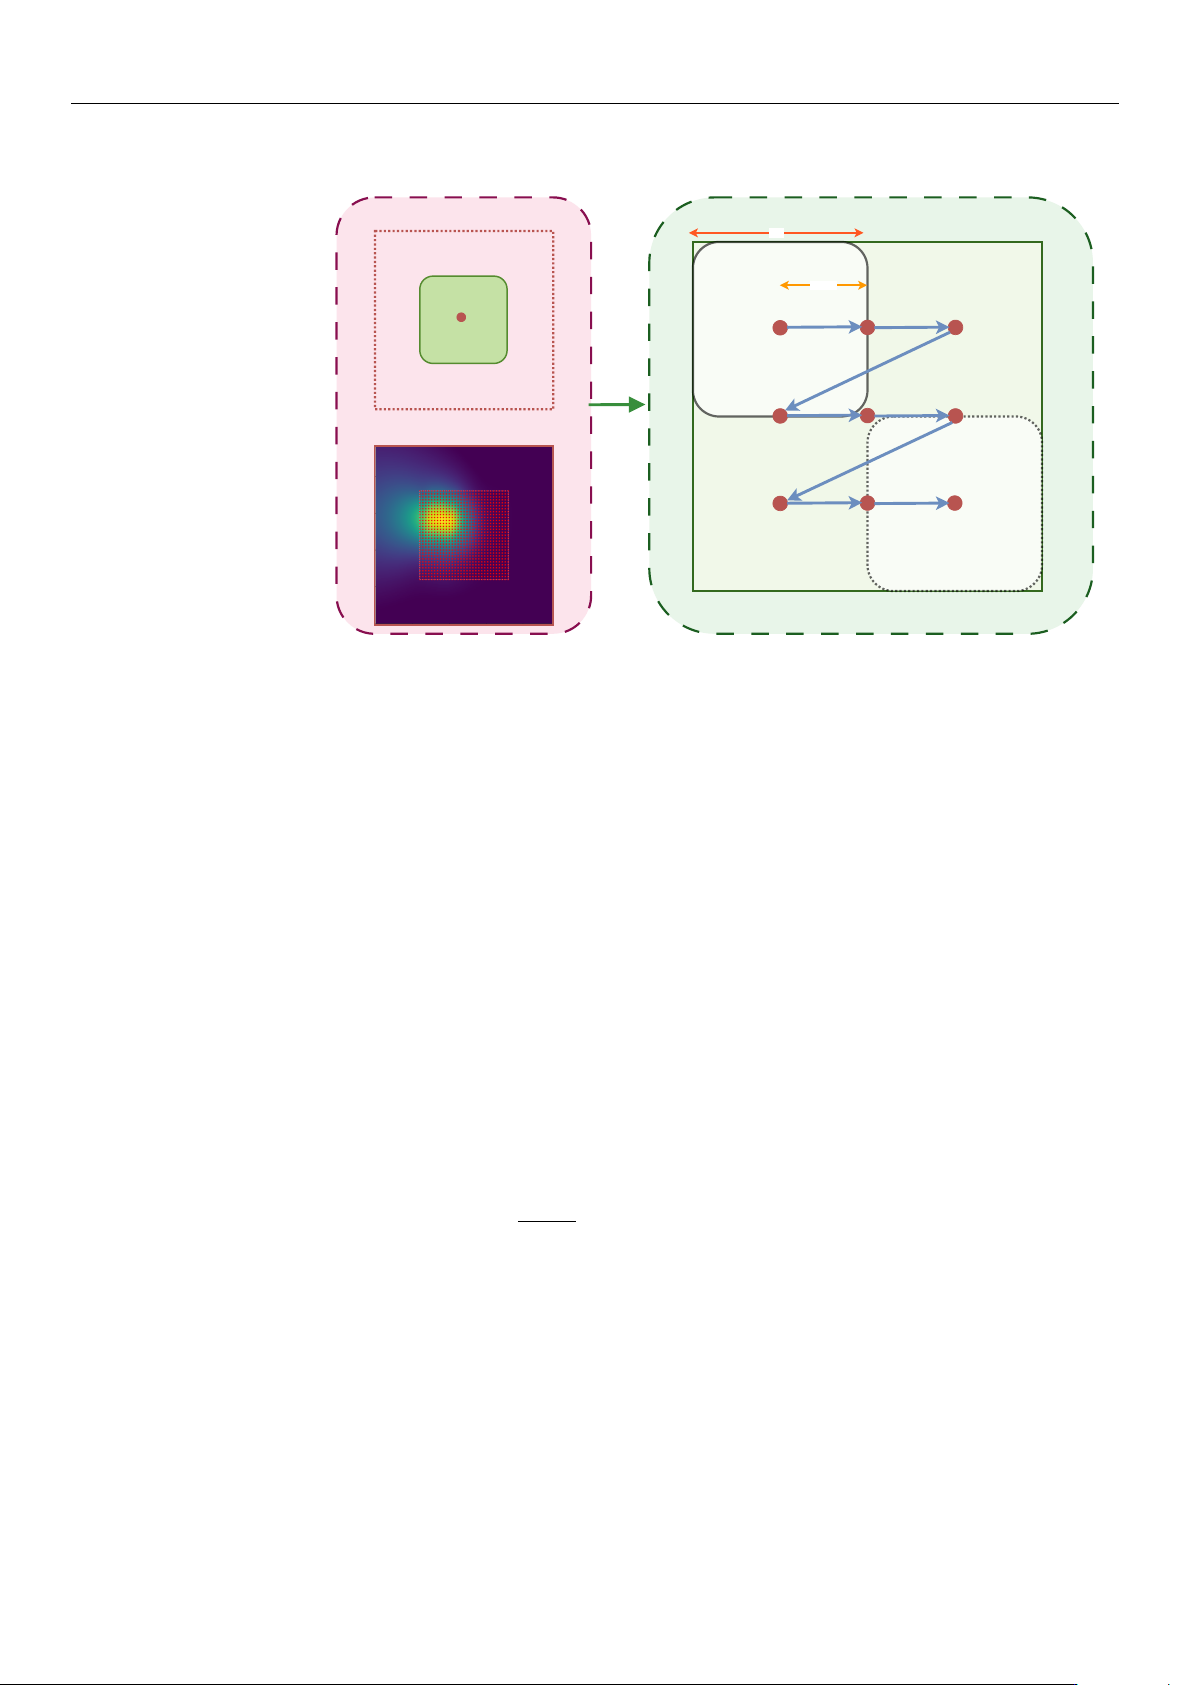
Micromachines 2026 , 17 , 592 13 of 34 The framework has three main components, as described in the following. STEP 2: RBF Fitting → Ground T ruth ( 240×240 ) STEP 3: Sliding Window Extraction (120×120 windows, 60 step) …

Micromachines 2026, 17, 592
12 of 34
into the photonic integrated circuit via an input grating coupler, propagates through a
dedicated on-die optical loopback waveguide, and is subsequently extracted through an
adjacent output grating coupler. The transmitted optical signal is collected by a return fiber
within the array and recorded by a high-speed optical power meter. This continuous data
stream provides the real-time optical power feedback required by the control software to
evaluate coupling efficiency and direct the piezoelectric actuators.
Utilizing this loopback configuration, eight distinct experimental alignment campaigns
were conducted across various grating coupler positions and individual dies. This exper-
imental design comprehensively captures the variability arising from die-to-die process
fluctuations and position-dependent spatial non-uniformities across the wafer. Further-
more, repeated measurements on a single die provide critical insight into overall system
repeatability and environmental stability. Each experimental campaign thus serves as
a highly realistic test case for evaluating algorithm robustness under authentic produc-
tion conditions.
The initial physical measurements were executed using baseline algorithm param-
eters. During this phase, the BO algorithms employed conservative settings: the Global
Bayesian method used 8 initial Latin-Hypercube sampled points [
42
] and a maximum of
70 iterations, while gradient-based methods used moderate, non-adaptive step sizes and
learning rates. These initial parameters, while functional, were not yet optimized for the
specific characteristics of the Eclipse Dynamic system or the optical coupling landscape
topology observed in practice. The experimental results presented in Section 4 therefore
reflect this initial algorithm configuration.
In the updated version of the alignment algorithms used for the comprehensive
simulation study, the methods were refined to maximize both efficiency and reliability.
Specifically, the gradient-based approaches were upgraded with adaptive step sizes and
finer convergence logic to better leverage the system 1 nm hardware positioning resolu-
tion. All detailed mathematical parameters and control logic for these refined algorithms,
including the specific adaptive formulations, are fully explained in Section 3.4. The sim-
ulation framework and the definitive results reported in Section 4 employ these refined,
production-ready configurations. By testing these optimized algorithms across 72 unique
spatial windows representing a 9
×
increase in scenario diversity compared to the initial
experiments, we established the final performance rankings and recommendations for
high-volume PIC manufacturing.
3.3. Simulation Framework
To enable systematic evaluation across a wider range of conditions, we developed a
simulation framework that generates synthetic alignment scenarios from experimental data.
The objective is to validate algorithm performance without requiring physical hardware
by creating high-resolution ground-truth surfaces from discrete measurement data, and
generating mock data files that mimic the limited field of view of the hardware during
operation. Figure 5 summarizes the simulation pipeline used in this work. Starting from
each experimental scan, we reconstruct a continuous ground-truth coupling surface via
Radial Basis Function (RBF) interpolation, to establish an extrapolated 240 V
×
240 V virtual
domain, from which we generate multiple mock scenarios by extracting 120 V
×
120 V
sub-windows at systematic offsets. For each mock scenario, the alignment algorithms are
executed and their recorded trajectories are converted to alignment time using the hardware
timing model. This approach allows for direct comparison across four distinct operating
regimes without requiring additional wafer measurements: low-speed (LS) and high-speed
(HS) actuation, each evaluated with (H) and without (NH) hysteresis compensation, to
provide LS-H, HS-H, LS-NH, and HS-NH scenarios.
https://doi.org/10.3390/mi17050592
Micromachines 2026, 17, 592
13 of 34
The framework has three main components, as described in the following.
STEP 2: RBF Fitting → Ground Truth
(240×240)
STEP 3: Sliding Window Extraction (120×120 windows, 60 step)
0,0
240,0
0,240
240,240
1
9
120
60 step
STEP 1: Input Data + Centering
Input 120×120
data Centered
(120, 120)
Figure 5. Simulation workflow used to generate synthetic alignment scenarios from experimental
scans and to evaluate alignment algorithms under different operating regimes. Experimental data are
reconstructed into a high-resolution coupling surface, windowed into multiple mock scenarios, and
then replayed through the hardware timing model (with/without reset-to-zero hysteresis strategy) to
produce comparable metrics across the four scenarios.
3.3.1. Surface Reconstruction and Centering
Starting from experimental scan data, we use RBF interpolation with multiquadric ker-
nel to create smooth coupling surfaces. The process consists of the following critical steps.
1.
Centering Strategy: The simulation standardizes the input data before fitting. It
computes the geometric center of the raw input scan and shifts the data so that it
aligns with the center (120, 120) of the global simulation grid. This ensures that the
peak is always accessible and not cut off at the edges of the simulation environment.
2.
Normalization: To ensure numerical stability during interpolation, the coordinates
are temporarily normalized to a 0–1 range.
3.
RBF Fitting: We utilize SciPy RBF interpolation function [
43
] with a multiquadric
kernel and smoothing factor (ϵ = 0.01) to create a mathematical surface:
P(x, y) =
N
∑
i=1
w
i
ϕ(∥[x, y] − [x
i
, y
i
]∥) (1)
where
ϕ(r) =
√
r
2
+ ϵ
2
is the multiquadric basis function,
w
i
are interpolation weights
determined from experimental data points (x
i
, y
i
, P
i
), and ϵ is the smoothing parameter.
4.
Grid Generation: A dense 240
×
240 pixel grid is generated, representing the ground-
truth power values for every possible coordinate in the simulation area. This creates a
continuous surface from the discrete experimental measurements.
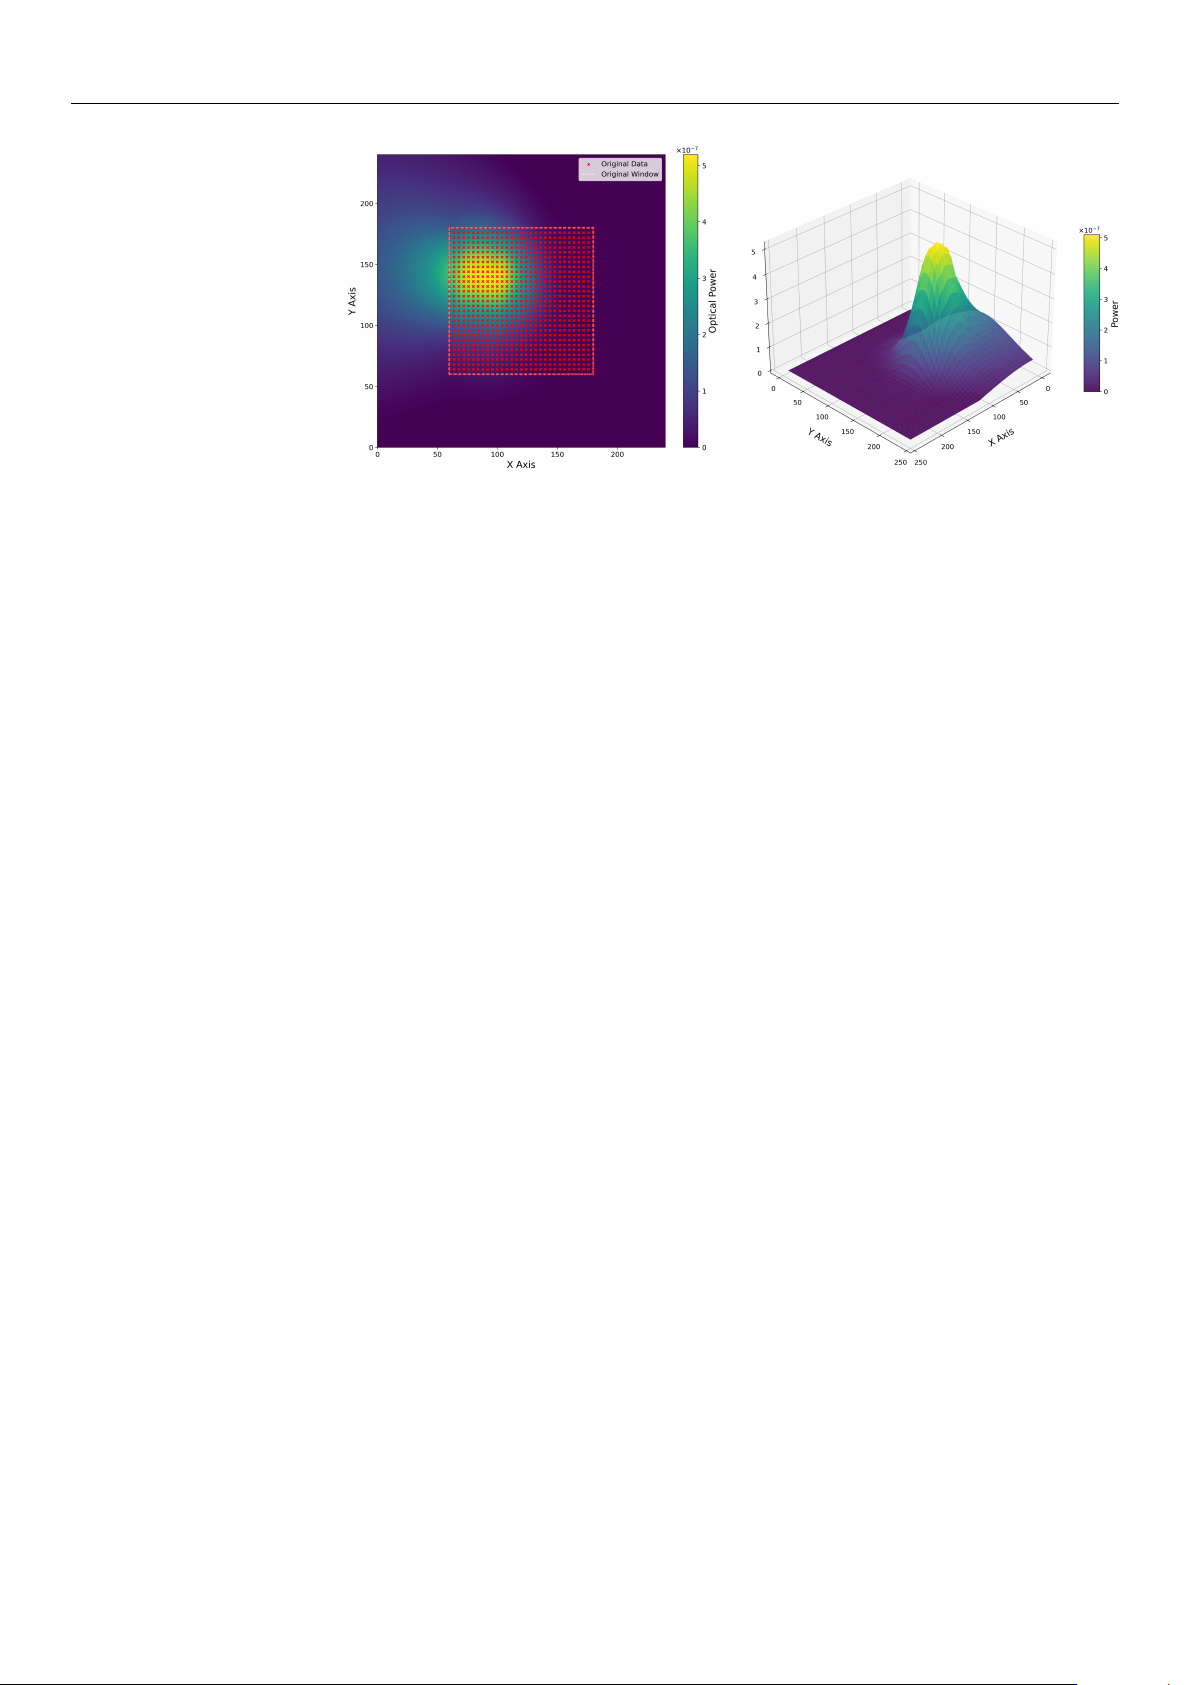
Figure 6 illustrates this surface reconstruction process. The heatmap (a) shows the
interpolated power landscape on the 240
×
240 global grid, with the original experimental
data points (red markers) centered at (120, 120) and the dashed rectangle indicating the orig-
inal 120
×
120 measurement window. The 3D surface plot (b) provides a three-dimensional
visualization of the optical coupling landscape, clearly showing the peak power region and
the smooth interpolation that extends beyond the measured data points.
https://doi.org/10.3390/mi17050592
Micromachines 2026, 17, 592
14 of 34
(a) (b)
Figure 6. Reconstructed optical power surface from experimental data. (a) 2D heatmap showing the
240
×
240 global grid with centered experimental data points (red markers within dashed rectangle).
(b) 3D surface visualization showing the smooth RBF interpolation and peak power region. The
surface extends beyond the measured region to create multiple mock test scenarios.
3.3.2. Environmental Simulation (Mock Scan Generation)
Real alignment hardware has a limited field of view corresponding to the piezoelectric
actuator range (120 V, equivalent to 15
µ
m displacement), while the simulated surface
is 240 units wide. To test algorithm robustness, the large surface is divided into smaller,
realistic views using a systematic sliding window technique, according to the following.
1.
Sliding Window Process: The sliding window process employs a fixed window size
of 120
×
120 units, which corresponds directly to the typical 0–120 V operating
range of the piezoelectric stage. To systematically evaluate the data, this window is
translated across the global 240
×
240 data matrix using a discrete step size of 60 units.
Originating at the (0, 0) coordinate of the global grid, the window slides through
sequential positions, such as (0, 60), (0, 120), and (60, 0), ensuring comprehensive and
overlapping coverage of the entire surface area in a structured grid pattern.
2.
Coordinate Localization: As the window moves to different positions (e.g., Global
X = 60 to 180), the system transforms the extracted data back to local coordinates
(0–120 V) by subtracting the offset from the window origin. This is critical, as it
ensures that the algorithms perceive every file as a standard 0–120 V hardware range,
indistinguishable from real operation.
3.
Mock File Generation: This systematic windowing process generates 9 distinct mock
CSV files from each experimental dataset. Each file contains only the X, Y, and Power
data visible within that specific 120 V
×
120 V window at offsets of 0, 60, and 120 V
in both dimensions. This forces the algorithms to locate the peak in various contexts
(e.g., peak centered, peak at the edge, or low-power regions), providing a rigorous
test of algorithm robustness across diverse initial conditions.
To provide a statistically rigorous benchmark, a comprehensive simulation library was
constructed from the 8 experimental datasets. Each experimental scan was interpolated
onto a 240
×
240 voltage grid using a multiquadric RBF to serve as a ground-truth coupling
landscape. From these, a total of 72 unique test scenarios (8 experiments
×
9 systematic
spatial offsets) were generated by extracting 120 V
×
120 V sub-windows at varying spatial
positions (offsets of 0, 60, and 120 V in each dimension). This systematic procedure ensures
that the algorithms are evaluated against a diverse set of initial peak positions relative to
the scan window, simulating a wide range of initial fiber-to-chip misalignments that might
occur in production testing.
https://doi.org/10.3390/mi17050592