mi17050592.pdf - 第26页
Micromachines 2026 , 17 , 592 26 of 34 In the Low-Speed regimes, the absolute time requir ed for alignment incr eases signifi- cantly due to the lower slew rates and settling times. In the LS-H scenario, see Figure 10 a, …
Micromachines 2026, 17, 592
25 of 34
The performance of the seven investigated algorithms was evaluated across the 72 sim-
ulated test cases derived from experimental data. We utilize data profiles to represent the
fraction of problems solved as a function of the total alignment time. A solved problem
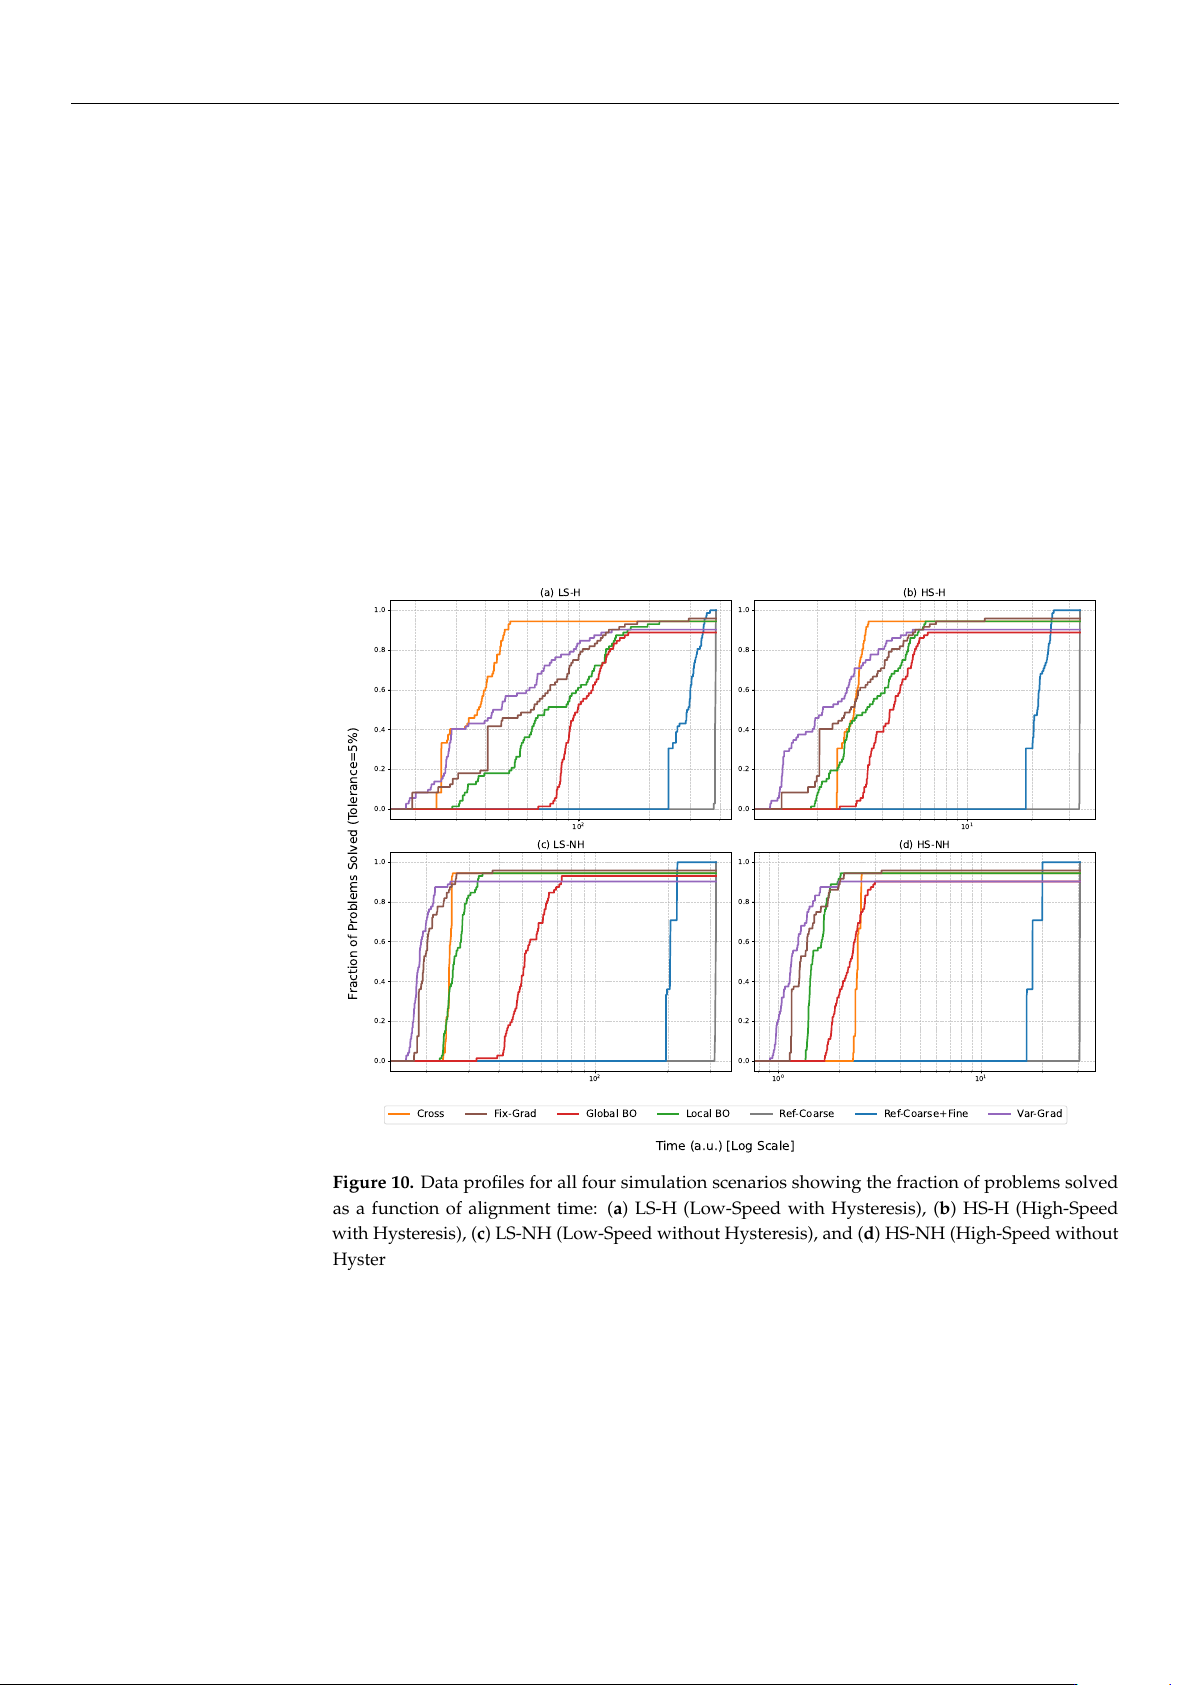
is defined as achieving a coupling power within 5% of the global maximum. Figure 10
illustrates these profiles across the four operating regimes. Figure 10b illustrates algorithm
performance under realistic high-speed conditions with active hysteresis effects (HS-H).
The Fix-Grad algorithm demonstrates the highest reliability (95.8%) across all 72 simulated
test cases in the HS-H regime. Local BO and Global BO are competitive but exhibit lower fi-
nal success rates (94.4% and 88.9%, respectively). Furthermore, while the Var-Grad method
shows the fastest initial convergence for simple scenarios, solving a significant fraction of
cases in under 2.6 a.u., it fails to achieve absolute reliability, plateauing at a 90.3% success
rate due to its inherent sensitivity to hysteresis-induced local maxima. This highlights
the robust advantage of the deterministic Fix-Grad approach, which maintains superior
accuracy and dependability even when the mandatory reset-to-zero strategy introduces
movement overhead to compensate for piezoelectric nonlinearities.
10
2
0.0
0.2
0.4
0.6
0.8
1.0
(a) LS-H
10
1
0.0
0.2
0.4
0.6
0.8
1.0
(b) HS-H
10
2
0.0
0.2
0.4
0.6
0.8
1.0
(c) LS-NH
10
0
10
1
0.0
0.2
0.4
0.6
0.8
1.0
(d) HS-NH
Time (a.u.) [Log Scale]
Fraction of Problems Solved (Tolerance=5%)
Cross Fix-Grad Global BO Local BO Ref-Coarse Ref-Coarse+Fine Var-Grad
Figure 10. Data profiles for all four simulation scenarios showing the fraction of problems solved
as a function of alignment time: (a) LS-H (Low-Speed with Hysteresis), (b) HS-H (High-Speed
with Hysteresis), (c) LS-NH (Low-Speed without Hysteresis), and (d) HS-NH (High-Speed without
Hysteresis). Note that the time axis is logarithmic to clearly visualize the significant speed advantage
of active alignment methods (<5.1 a.u.) over exhaustive reference scans (>257.1 a.u.). Fix-Grad
achieves the highest and most consistent reliability (95.8%) across all scenarios, while Global BO
shows scenario-dependent reliability (88.9–93.1%) and Var-Grad shows the fastest initial convergence
but lower final reliability (90.3%).
Comparing Figure 10b–d (HS-NH), the removal of hysteresis effects results in a left-
ward shift of the performance curves, reducing absolute alignment time by approximately
50–57% for gradient and Bayesian methods, consistent with the figures reported in Table 3.
However, the relative performance ranking remains unchanged. This suggests that while
hysteresis imposes a time penalty, the probabilistic nature of the Bayesian methods inher-
ently manages these non-linearities more effectively than pure hill-climbing approaches.
https://doi.org/10.3390/mi17050592

Micromachines 2026, 17, 592
26 of 34
In the Low-Speed regimes, the absolute time required for alignment increases signifi-
cantly due to the lower slew rates and settling times. In the LS-H scenario, see Figure 10a,
the Ref-Coarse and Ref-Coarse+Fine scans become impractical for volume production, re-
quiring over 257.1 a.u. per die. The Cross provides a middle-ground baseline, consistently
solving approximately 90% of the problems within a predictable time budget. However, like
the gradient methods, it struggles with the highest-precision requirements. The Bayesian
methods maintain their dominance in reliability, achieving the highest final success rates
even as the absolute time scales upward.
Data profile analysis reveals distinct convergence behaviors across all evaluated sce-
narios. Local BO exhibits steep, consistent trajectories that secure high success rates within
moderate step budgets, whereas Global BO demonstrates a similar but marginally slower
initial ascent due to the absence of cross-scan initialization. Among gradient techniques, Var-
Grad displays the steepest initial rise but suffers an early performance plateau, indicating
fundamental failure cases on challenging coupling landscapes. Conversely, Fix-Grad main-
tains a steady progression toward maximum reliability, confirming its status as the most
dependable gradient approach with a 100% experimental success rate. Furthermore, the
one-dimensional Cross method prematurely plateaus near 75–80% success, while exhaus-
tive reference techniques require an impractical hundreds of measurements to converge.
Analyzed according to the statistical methodology of Beiranvand et al. [
18
], these profiles
confirm that Local BO and Fix-Grad offer the best combination of speed and reliability
across the operating conditions tested.
4.3. Algorithm Robustness
Table 5 quantifies the convergence reliability across all simulation scenarios, measuring
the percentage of trials achieving
≥
95% of global maximum power. The reliability analysis
establishes Fix-Grad as the most robust optimization algorithm, achieving a consistent
95.8% success rate across all simulation scenarios. Global BO remains a strong contender,
achieving 93.1% success in idealized (LS-NH) conditions and maintaining around 89%
reliability in the presence of hysteresis. This represents a significant improvement over
earlier baselines, although it does not yet match the consistency of the deterministic Fix-
Grad method.
Table 5. Convergence reliability of the alignment algorithms (defined as the percentage of trials
reaching ≥95% of optimal power).
Algorithm HS-H HS-NH LS-H LS-NH
Ref-Coarse 100.0 100.0 100.0 100.0
Ref-Coarse+Fine 100.0 100.0 100.0 100.0
Cross Scan 94.4 94.4 94.4 94.4
Local BO 94.4 94.4 94.4 94.4
Global BO 88.9 90.3 88.9 93.1
Var-Grad 90.3 90.3 90.3 90.3
Fix-Grad 95.8 95.8 95.8 95.8
5. Discussion
5.1. Experimental Versus Simulation Performance
The experimental results in Table 1 provide a validation of algorithm performance
on real PIC alignment tasks. The 100% success rates achieved by Local BO and Fix-Grad
methods in experiments are particularly significant, as they demonstrate robustness across
eight diverse coupling scenarios. This diversity stems from characterizations performed
across seven different dies distributed to cover the full wafer surface as comprehensively
as possible, spanning multiple reticle positions, supplemented by repeated measurements
https://doi.org/10.3390/mi17050592

Micromachines 2026, 17, 592
27 of 34
on the same die to account for environmental stability and system repeatability. By encom-
passing these variations in die location and characterization cycles, the results confirm that
the proposed algorithms can generalize effectively across the typical process and placement
variations encountered in high-volume wafer-level testing.
In terms of the interpretation of experimental rankings, results reflect the performance
of algorithms with baseline parameters on a limited but highly realistic dataset of 8 coupling
scenarios. Local BO achieved rank 1 due to its perfect 100% success rate combined with
the fastest alignment time (99.87 a.u.) among the successful methods. Fix-Grad achieved
rank 2, also with 100% success but requiring more time (154.01 a.u.). Global BO, despite
strong performance metrics (97.60% accuracy), achieved only 87.5% success rate, placing
it at rank 3. This lower success rate in the experimental phase reflects the conservative
baseline parameters used at that stage, which had not yet been optimized for the specific
characteristics of the Eclipse Dynamic system.
Following the experimental phase, an iterative improvement of the methods was
conducted to refine the algorithm. The simulation study, which evaluated all the seven
algorithms across 72 test scenarios (8 experiments
×
9 spatial offsets), employed these im-
provements. This larger statistical sample and improved parameterization led to different
performance rankings compared to the experimental results, revealing the true performance
characteristics across diverse initial conditions.
The simulation framework reliably mimics real-world constraints. The RBF inter-
polation accurately captures landscape topologies, evidenced by the strong quantitative
agreement between experimental data (e.g., Local BO experimental accuracy of 98.24%) and
simulated outcomes (98.2–98.3%), indicating minimal uncertainty from the data processing
and validating the fidelity of framework.. The difference in the success rates primarily
reflects the evolution from baseline to changes of the algorithms and parameters, and the
statistical power of the larger simulation dataset.
Given that the simulation results employ improved methods and parameters and a
statistically rigorous evaluation across 72 scenarios, they provide the most reliable basis
for production deployment recommendations. The experimental results validate the fun-
damental algorithmic approaches and confirm real-world viability, while the simulation
results guide the selection of parameters and operating regimes.
5.2. Algorithm Selection Guidelines Across Operating Scenarios
The choice of an optimal alignment algorithm for the Eclipse Dynamic system de-
pends on the operating speed capability and the effectiveness of hysteresis compensation.
Comprehensive recommendations for each of the four evaluated scenarios are provided
next, progressing from worst-case to ideal-case conditions.
5.2.1. Scenario 1: LS-H (Low-Speed with Hysteresis)
This configuration establishes the baseline worst-case scenario, defined by conser-
vative hardware actuation speeds coupled with uncompensated piezoelectric hysteresis.
Under these conditions, the mandatory reset-to-zero maneuvers impose substantial tem-
poral overhead, while the restricted slew rates further exacerbate the latency associated
with each trajectory adjustment. Based on these stringent operating parameters, Fix-Grad
emerges as the optimal choice for maximizing process yield (see Tables 3 and 5). While
the Var-Grad approach operates faster, its approximate 10% failure rate requires manual
intervention, preventing any speed advantage in a production setting. Furthermore, the
substantial temporal penalties imposed by mandatory reset-to-zero maneuvers dispropor-
tionately degrade the performance of Bayesian approaches in this slow-actuation regime,
leaving Fix-Grad as the most robust and practical solution.
https://doi.org/10.3390/mi17050592