slau358q.pdf - 第49页
www.ti.com Status Messages 49 SLAU358Q – September 2011 – Revised October 2019 Submit Documentation Feedback Copyright © 2011–2019, Texas Instruments Incorporated Operation 2.3 Status Messages The current status is alway…
Data Viewers
www.ti.com
48
SLAU358Q–September 2011–Revised October 2019
Submit Documentation Feedback
Copyright © 2011–2019, Texas Instruments Incorporated
Operation
Contents of flash memory data can be viewed by selecting the View→Flash Memory Data option from the
drop-down menu. To be able to see flash memory contents, the Read button must be used first (as
described in Section 2.1.1). The Flash Memory Data viewer displays the memory addresses, data in hex
and ASCII format in the same way as the Code data viewer shown in Figure 2-23.
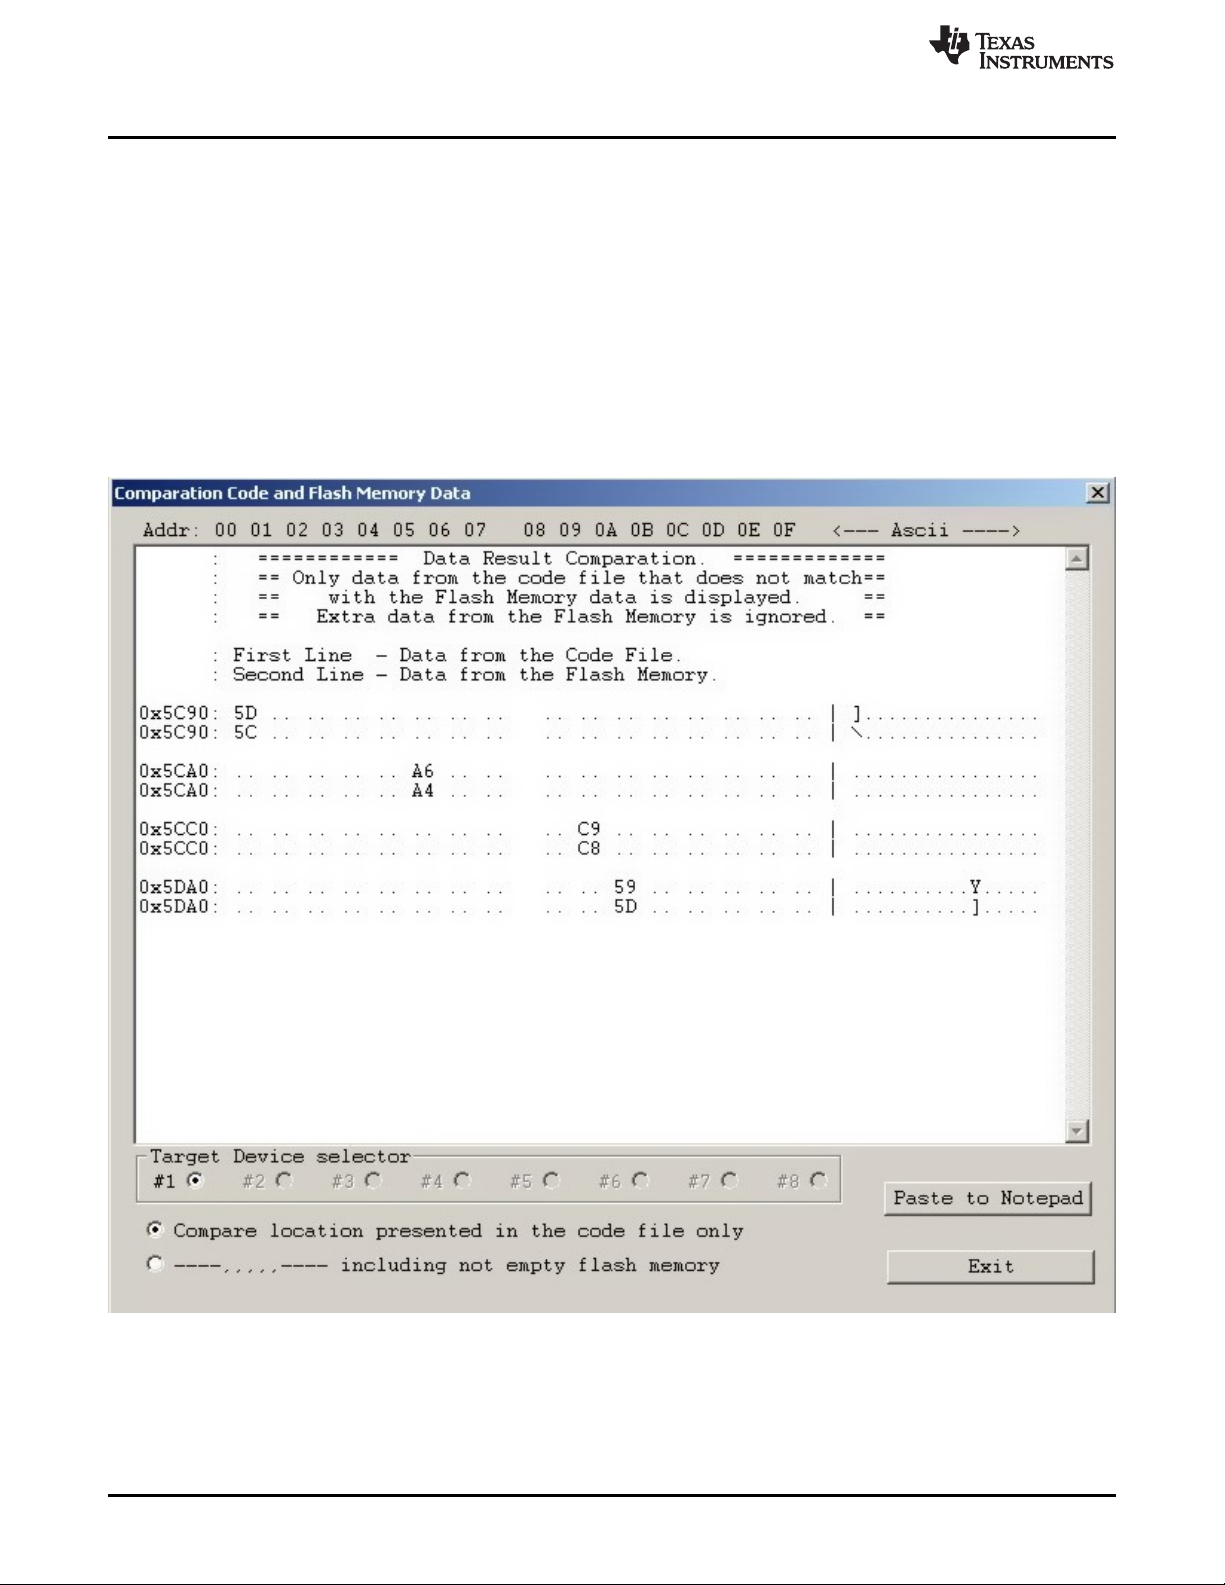
Contents of the code file and flash memory can be compared and differences can be displayed in a the
viewer by selecting the View→Compare Code & Flash Data options from the drop-down menu. Only data
that are not the same in the code file and the flash memory are displayed. The first line displays code file
data, and the second line displays flash memory data as shown in Figure 2-24.
The Compare location presented in the code file only option is chosen by default. This option allows the
user to view differences between Code file data and corresponding flash contents (compared by address).
Additional data in the flash like DCO calibration and personal data is not compared but can be displayed if
desired. If all the aforementioned data are identical, then a "No difference found" message is displayed on
the screen.
NOTE: Only bytes that differ are shown. The selected option on the bottom of the figure specifies that only
memory segments corresponding to the code file should be compared. The second option, if selected,
performs the comparison and shows any remaining contents of flash memory that do not correspond to the
code file.
Figure 2-24. Comparison of Code and Flash Memory Data of the Target Microcontroller

www.ti.com
Status Messages
49
SLAU358Q–September 2011–Revised October 2019
Submit Documentation Feedback
Copyright © 2011–2019, Texas Instruments Incorporated
Operation
2.3 Status Messages
The current status is always displayed at the bottom of the progress bar, as shown in Figure 2-1, and
previous status and error messages are shown in the history window in the bottom left corner. are
displayed in the report window.
All procedures in the MSP Gang Programmer are divided into small tasks to be executed in series. When
first task is finished successfully, then the next task is started. Each task has is own consecutive number
assigned by the task manager when the image is created. The most commonly executed tasks are listed
below:
• Initialization
• Open Target Device
• Close Target Device
• Erase
– Segment
– Main memory
– Info memory
– BSL memory
• Blank check
• Program
• Gang Program (program unique data to each target)
• Write RAM
• Write GANG RAM (write unique data to each target)
• Verify
• Read memory
• Save Info-A
• DCO calibration
• Retain Info-A
• SetPC and run
• Capture PC and Stop
• Stop PC
• Secure device
• Finish
For example, the operations Erase, Program ,and Verify execute the following tasks:
• Initialization
• Open Target Device
• Erase
• Blank check
• Program
• Verify
• Close target and finish.
These tasks execute the easiest programming process in small MCU devices. The aforementioned tasks
can be divided into smaller tasks that only erase one segment, erase info segment, or erase one block of
the main memory. For that reason, many more tasks are displayed in the report window than are
described above. For example, when programming the MSP430F5438 the following information would be
displayed in the report window:

Status Messages
www.ti.com
50
SLAU358Q–September 2011–Revised October 2019
Submit Documentation Feedback
Copyright © 2011–2019, Texas Instruments Incorporated
Operation
Executing Main Process...
.............
2 : init target
3 : erasing-Info
4 : erasing-Info
5 : erasing-Info
6 : erasing-Main
7 : erasing-Main
8 : erasing-Main
9 : erasing-Main
10 : erasing-Main
11 : erasing-Main
12 : erasing-Main
13 : erasing-Main
14 : erasing-Main
15 : Blank-1800
16 : Blank-1880
17 : Blank-1900
18 : Blank-5C00
19 : Blank-10000
20 : Blank-20000
21 : Blank-30000
22 : Blank-40000
23 : Write-FC00
24 : Write-FC90
25 : Write-FD10
26 : Write-FD80
27 : Write-FFE2
28 : Verify-FC00
29 : Verify-FC90
30 : Verify-FD10
31 : Verify-FD80
32 : Verify-FFE2
33 : Gl.Verify-1800
34 : Gl.Verify-5C00
35 : Gl.Verify-10000
36 : Gl.Verify-20000
37 : Gl.Verify-30000
38 : Gl.Verify-40000
39 : closing target
40 : Done
0 : Finished
This report indicates that sectors INFO-B, INFO-C, INFO-D, and the main memory block have been
erased (tasks 2 to 14) blank checked (tasks 15 to 22), programmed (tasks 23 to 27) and verified (tasks 28
to 38). Finally, access to target devices is closed and the programming process is finished. Length of task
description (including consecutive task number) is limited to 16 characters to be able display this
information on the third line of the MSP Gang Programmer LCD display.
The MSP Gang Programmer can process up to 1000 tasks per one image saved in internal memory.
Having that number of available tasks and one or more code files saved in internal memory (total memory
footprint of up to 512KB in one image), the MSP Gang Programmer gives the user significant flexibility to
perform custom programming procedures. If for any reason the code files and task scripts require more
than 512KB of memory, then the next image memory can be taken and combined with the first one for one
larger image block (1Mbyte or more). The MSP Gang Programmer has internal flash memory of 8Mbyte
that can, if desired, all be used to form one image with a memory footprint of 8Mbyte.
Error messages are displayed similarly to status messages, however, programming is terminated if the
error is related to all target devices. Subsequently, if the problem is resolved or the faulty target device is
disabled, then the programming procedure can be restarted to complete the programming process. The
result for all devices is reported in the results section (green or red icons). When the global status is
reported as FAIL, see the result section for details. Similarly, the MSP Gang Programmer uses red and
green LEDs to indicate the result of its operations (red indicates failure) and details are displayed on the
LCD display. Below is the list of errors reported in the MSP Gang Programmer.