200823.TR3000-IRV English Manual.pdf - 第20页
IR AUT O BGA R ework S tation TR3000-IRV Kukjetrading Co., Ltd. 20 W h en the data is touched, a r an g e w indow appears on the right. It can analyze 4 ranges from the ran ge 1 t o 4 which are on the right of t h e …
IR AUTO BGA Rework Station TR3000-IRV
Kukjetrading Co., Ltd.
19
the actual temperature would rise more than expected. This value is the maximum condition revealed
by the device shipment test so it could be changed to the actual value which has been measured.
♣ IR : It is for MODE 1~3 and it can be changed within a range of 70%~130%. (Standard 100%)
♣ TK : It is for compensating an error if there is an error in a value which is computed by measuring and
analyzing a temperature of a PCB. It can be changed within a range of 70%~130%. When this
value is low, the actual temperature is low as well.
♣ M4 : It is for MODE 4 and it can be changed within a range of 70%~130%. (Standard 100%)
♣ BOT : It is for Bottom heater and it can be changed within a range of 70%~130%. (Standard 100%)
♣ BTemp : It is temperature for PRE-HEAT (Standard 180degree)
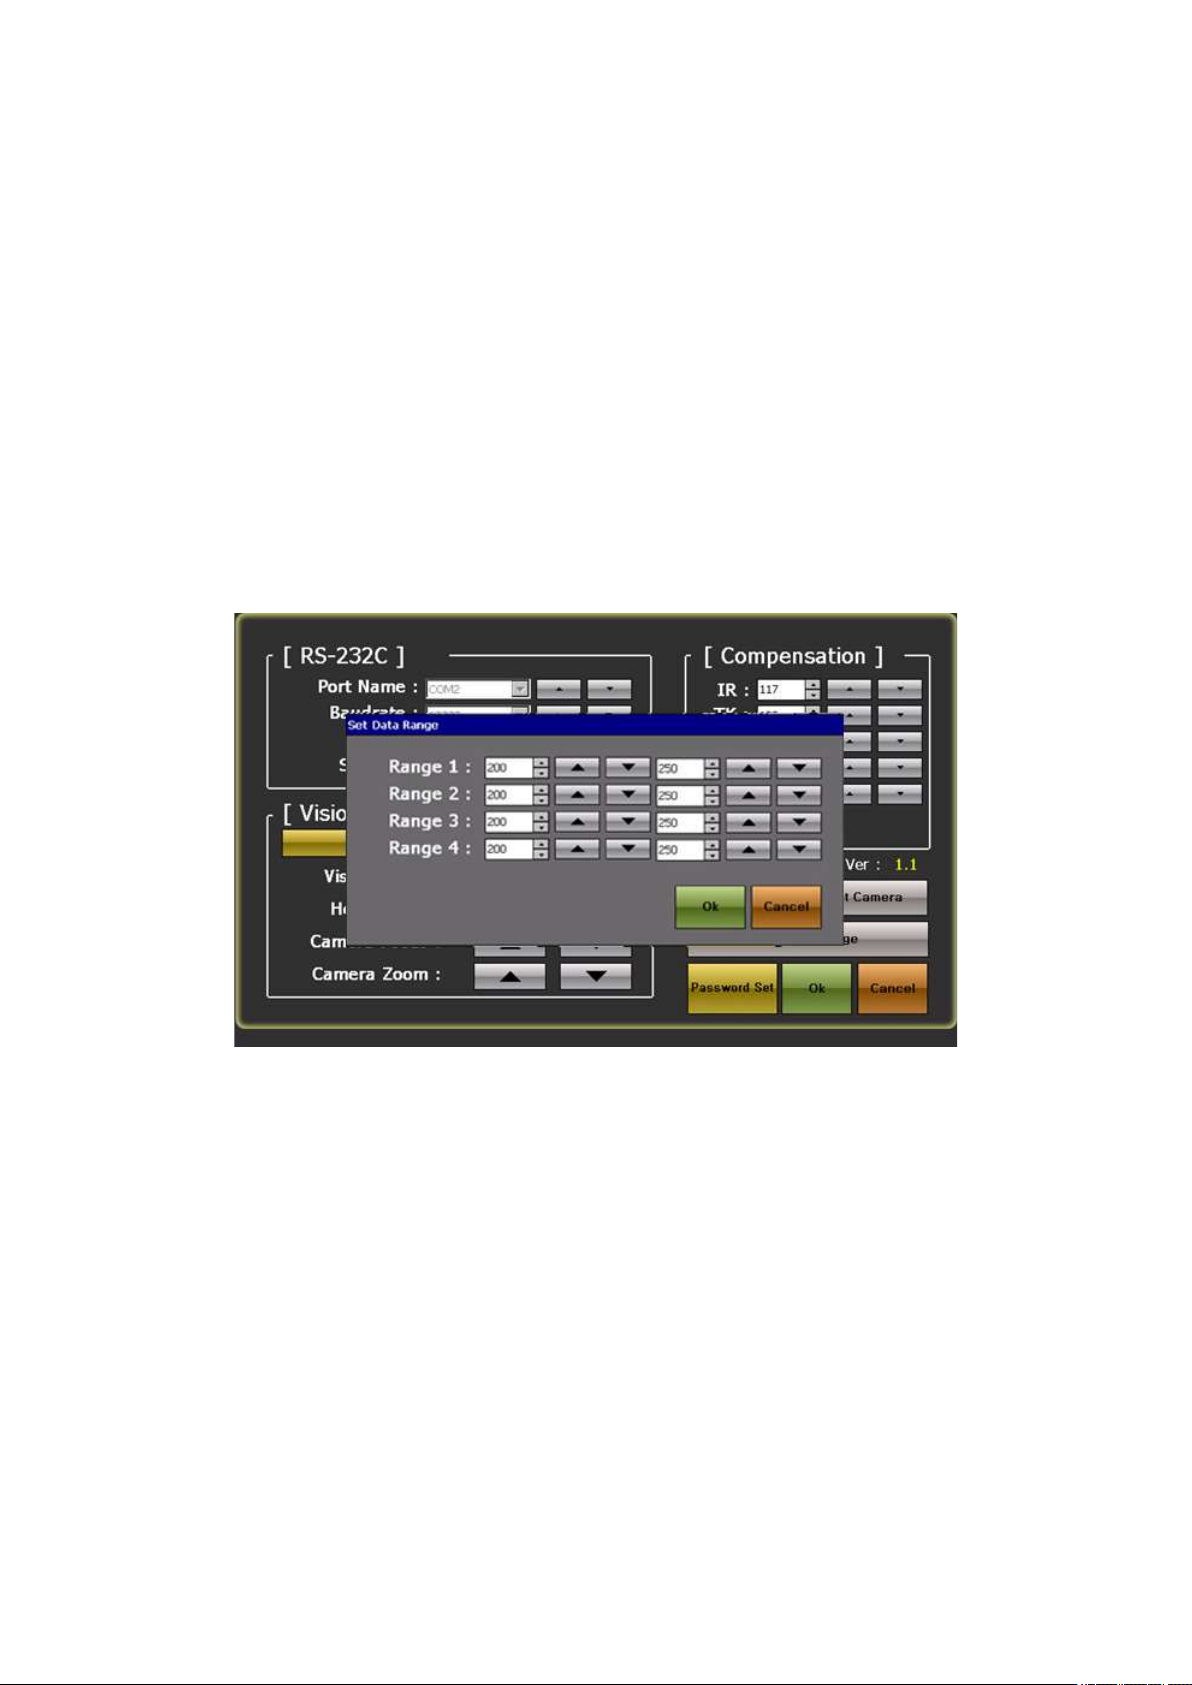
IV. Set data Range :
It is possible to preset a range of analysis of data which appears when a DATA button is pressed. When the
maximum/minimum temperature range is present, time within such temperature range would be output. Value on
the left should be set to minimum and value on the right to maximum. For example, when the device gets operated
after entering a range 1: 150~180, it is possible to check the analysis time after completion of the operation.
5.2 About DATA
It is for measuring and analyzing the operation temperature and Save and Open it if necessary. It provides
the same function as the profiler.
IR AUTO BGA Rework Station TR3000-IRV
Kukjetrading Co., Ltd.
20
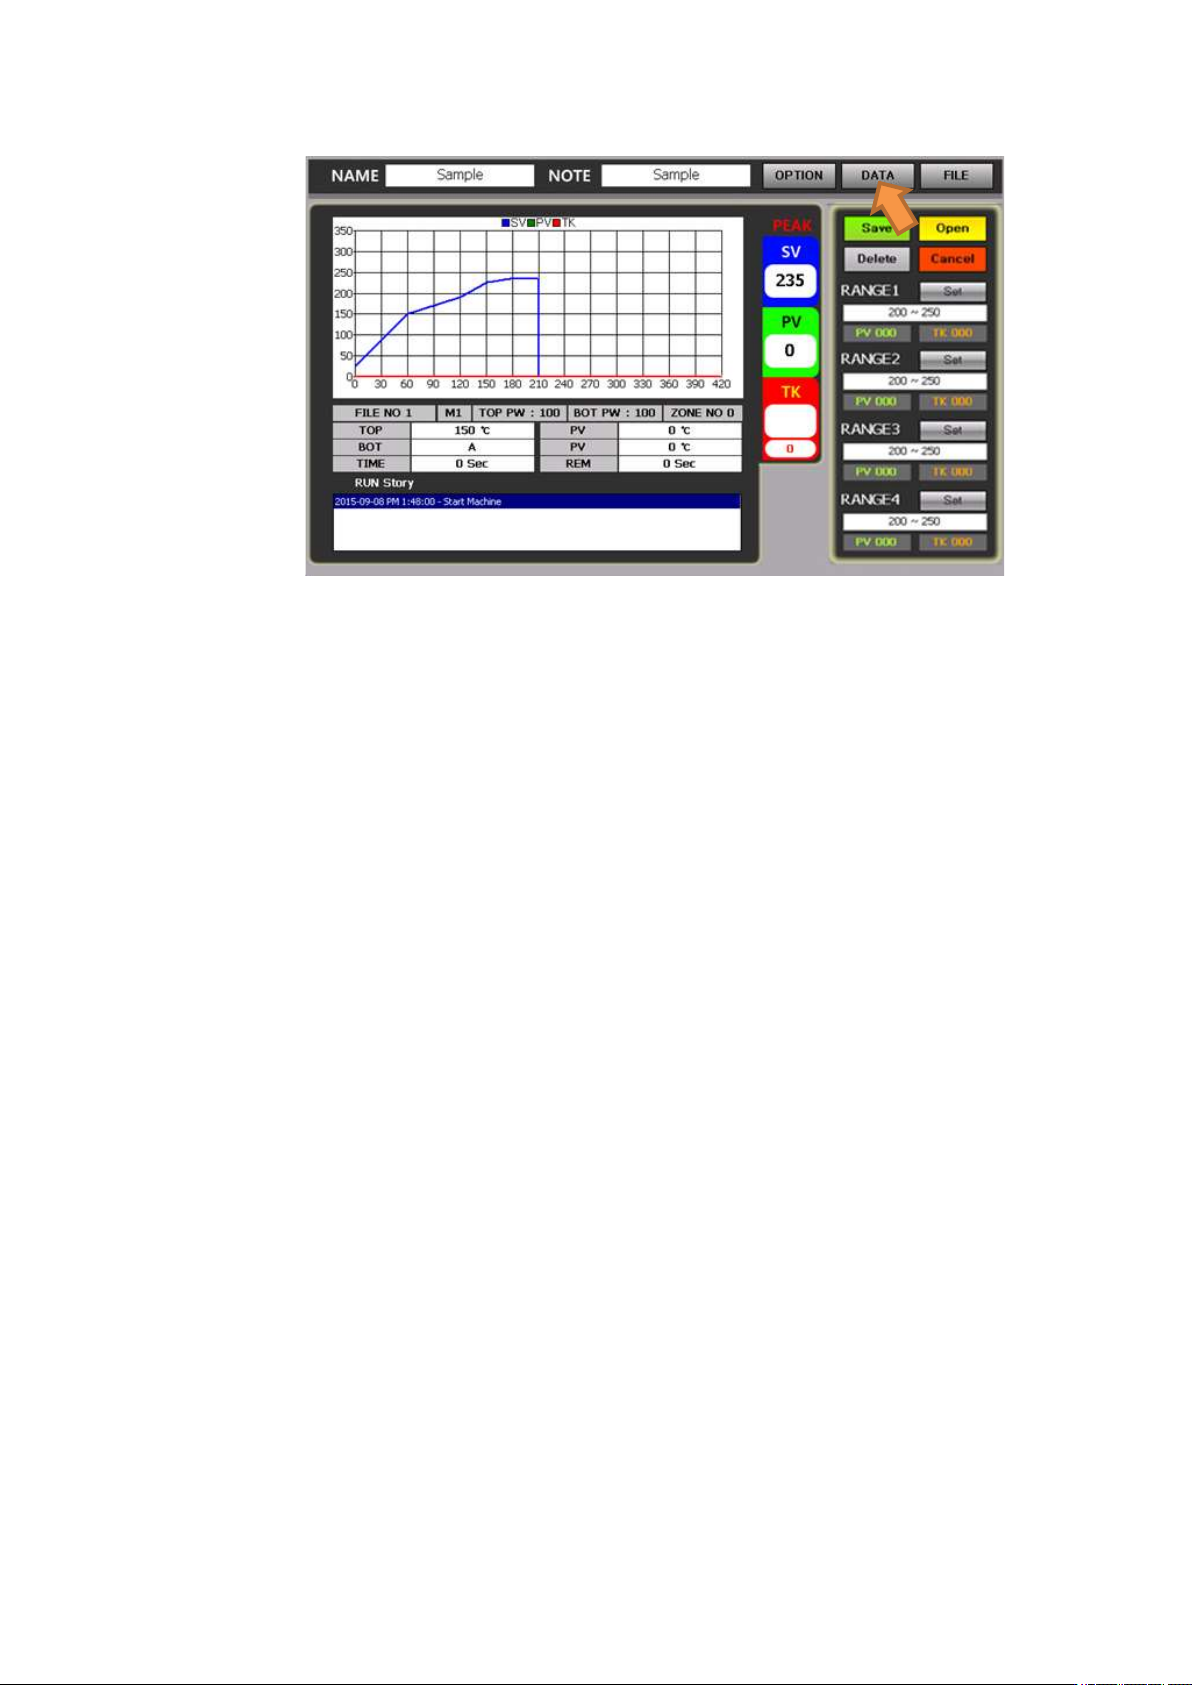
When the data is touched, a range window appears on the right.
It can analyze 4 ranges from the range 1 to 4 which are on the right of the screen. .
Touch set keys next to the range 1 to 4 to click a triangle table for each of the range 1 and the range 2 to
set a temperature range to be analyzed.
When an OK button is touched, elapse time for the corresponding zone is displayed in number next to
the PV and TK.
With a save button or a delete button, it is possible to save or delete data onto the file.
5.2.1 Use DATA
① Adhere the end of a K-type wire sensor to a part to be worked with by using heat resistant tape and insert
a connector to a TK socket on the front of the device.
② After mounting a PCB onto a table, fasten it with screws which are used for fixing of space. During the
process, it becomes much easier if a board is fixed with a laminated-board fastening jig and a bottom
bending-prevention jig.
③ Press a center button to operate a vision camera.
④ Move a slide table to adjust the center of a vacuum bit to the center of a part. .
⑤ Check if a button of the heater 1 has been pressed. A large board should be selected by pressing up to the
heater 2.
⑥ Adjust the width of a splashback of an upper heater.
⑦ Press a RUN button to start heating.
⑧ The device operates in accordance with profile conditions and on the screen, PV values and TK values
are displayed in number and graphs are shown.
⑨ The operation is completed in accordance with the selected profile conditions and while a head elevates,
a cooling fan operates.
⑩ Press a “DATA” button, on the upper right of a screen, to select.
⑪ The initial temperature range is displayed on options. From the range 1~4, touch a set key to set a
temperature range to be changed and then, press OK. Then, elapse time within the preset temperature
range is displayed in a unit of second.
IR AUTO BGA Rework Station TR3000-IRV
Kukjetrading Co., Ltd.
21
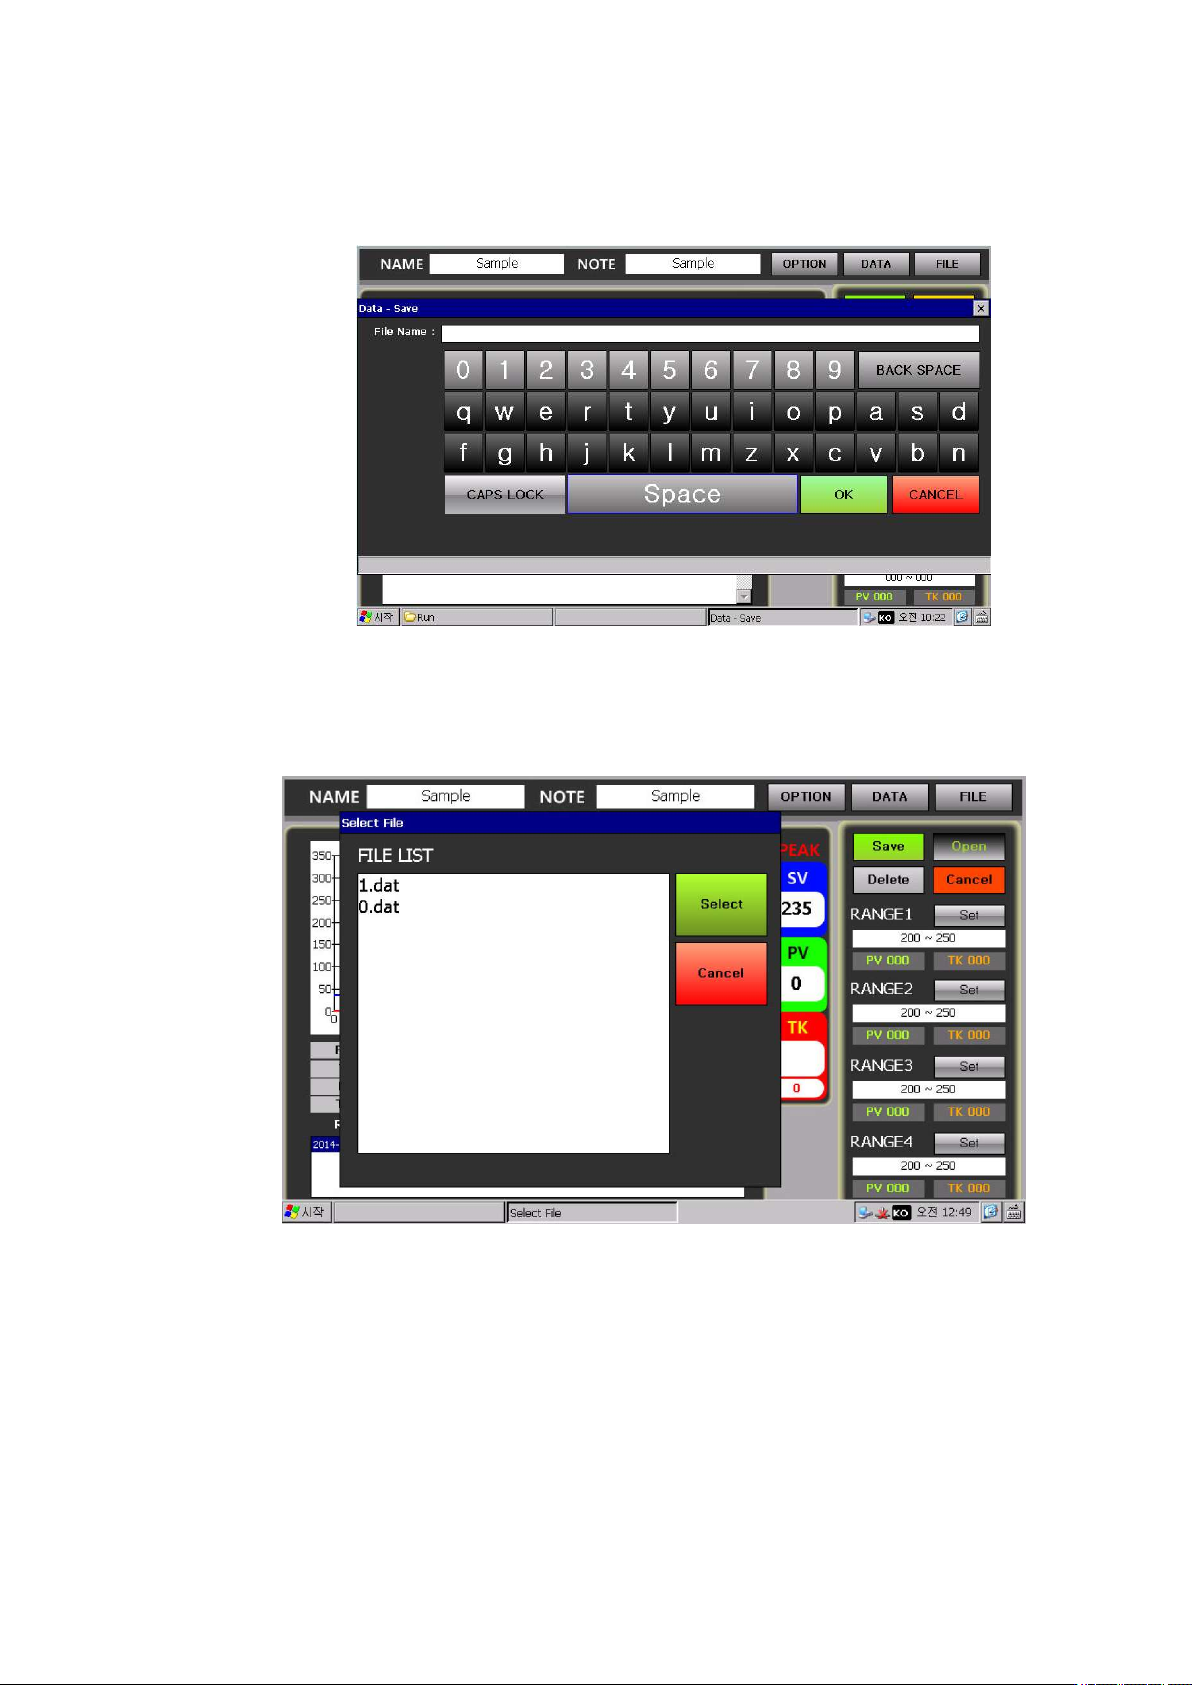
⑫ As for this data, click Save and then use the key shown as follows to register and save a file name.
However, such data file is saved onto a SD card in general and if there is no SD card, it gets saved onto
a NandFlash Memory.
⑬ Since the memory capacity of a Nand Flash is limited, try not to save a lot of data files.
⑭ To call the saved Data file, click OPEN. Then, a list of data files which have been saved is displayed as
File List shown as follows. Select one file from the file list and then press Select. Then, the selected data
would be opened and its graph and analysis data would be displayed.