3OM-1751-002w_G5S.pdf - 第73页
3OM-1751 1-19 1303-001 4.2.1 "Log Demand" T ab Sheet This tab sheet enables the operator to demand the log of the linear measure sensor E/NR traces. [3] [4] [5] [6] [8] [7] [1] [2] F3A16 [1] Head Sel Each head …
3OM-1751
1-181303-001
4.2 "LINE MEAS" Window
The E/NR traces of the linear measure sensors on each placement head are
expressed by a chart or using numerical values. "E/NR" stands for "Light Emitted
and Not Received".
This window also enables you to check the end of the currently selected nozzle
and the compensative data for the linear measure sensors.
[1]
F3A15
[1] Tabs
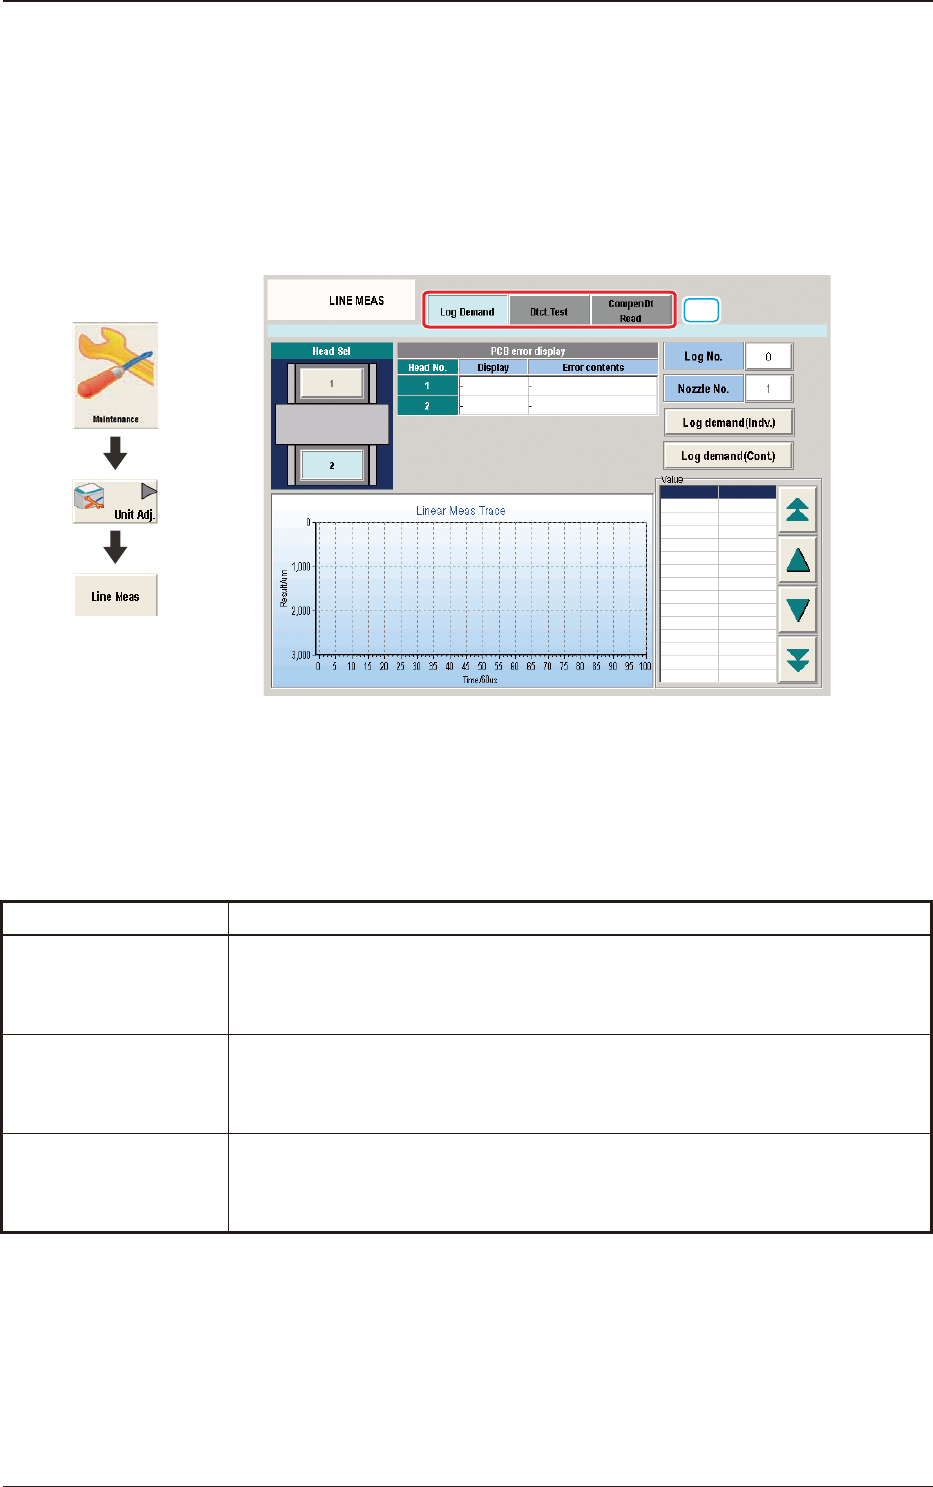
The "LINE MEAS" window is provided with the following three tabs. When
each tab is pressed, the corresponding tab sheet appears.
Tabs Description
Log Demand
When pressed, this opens the "Log Display" window, enabling you to view the
log of the linear measure sensor E/NR traces.
Dtct. Test
When pressed, this opens the "Detection Test" window, enabling you to
perform a check operation for the nozzles and its ends on the specied head.
The results are displayed after the operation.
Compen Dt Read
When pressed, this opens the "Compen Dt Read" window, enabling you to
read the compensative data.
T3A2
Graphic
Development
4.2 "LINE MEAS" Window
3OM-1751
1-191303-001
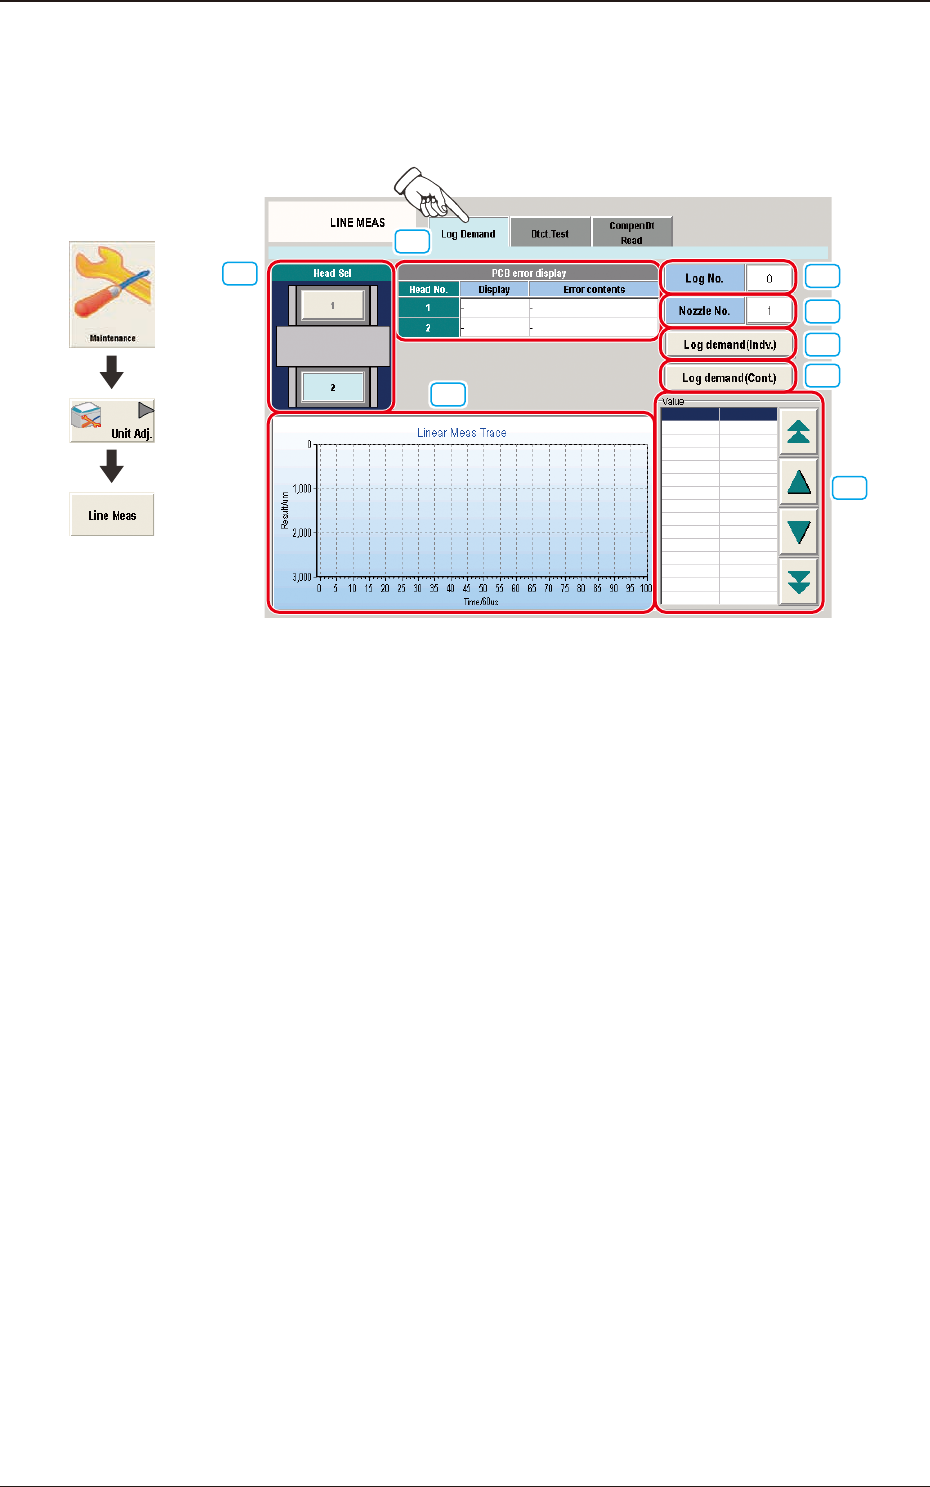
4.2.1 "Log Demand" Tab Sheet
This tab sheet enables the operator to demand the log of the linear measure sensor
E/NR traces.
[3]
[4]
[5]
[6]
[8]
[7]
[1]
[2]
F3A16
[1] Head Sel
Each head section in the graphic image of the machine is provided with a
button function.
Select the head for which the log of the linear measure sensor E/NR traces is
demanded.
[2] PCB error display
Displayed are the codes and contents of errors that have occurred for each
head.
[3] [Log No.] Button
When pressed, this button opens the "Log No." entry window.
Specify the number of the log for which the measured results should be
displayed.
[4] [Nozzle No.] Button
When pressed, this button opens the "Nozzle No." entry window.
Specify the number of the nozzle for which the measured results should be
displayed.
[5] [Log demand (Indv.)] Button
When pressed, this button displays the progress data of the E/NR traces for
the specied log No.
Graphic
Development
4.2 "LINE MEAS" Window

3OM-1751
1-201303-001
[6] [Log demand (Cont)] Button
When this button is pressed, the linear measure trace data of the Log Nos. 0
to 15, is displayed.
[7] Chart of Linear Meas Trace
Displayed is a chart of the linear measure sensor E/NR traces.
[8] "Value" Group Box
Displayed are the numerical values that represent the E/NR trace of the linear
measure sensor.
The data to be displayed can be scrolled up or down with the arrows on the
right vertical scroll bar.
4.2 "LINE MEAS" Window