SIPLACE OIS Version 13.1 Getting Started.pdf - 第16页
2 Overview: The user Interface Getting Started with SIPLACE OIS 05/2016 EN Edition Software Version 13.1 16 Description of fields: 2 Number of PCBs: 2 Conveyor Lane Right: Number of PCBs produced on the right conveyor la…
Getting Started with SIPLACE OIS 2 Overview: The user Interface
Software Version 13.1 05/2016 EN Edition
15
2
Note
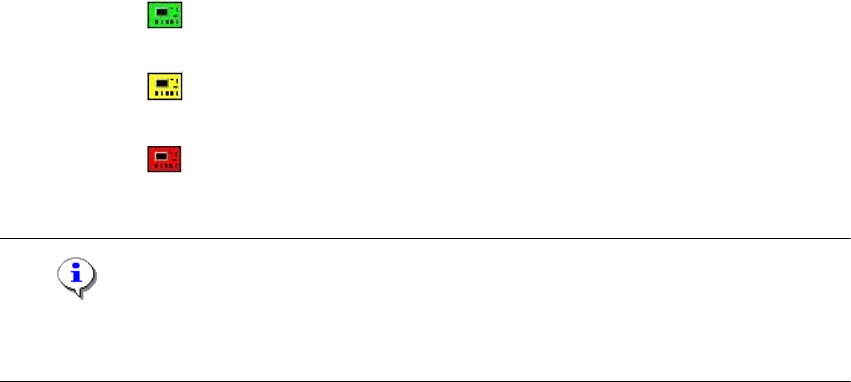
PCBs that are not fully assembled are highlighted in red and are not included in subsequent
figures. PCBs that are fully assembled are highlighted in green. 2
End 2 Time of completion. 2
State 2 The status is interpreted as a bit array. 2
2 1st bit 2 True = Production of PCB was aborted.
False = PCB was produced. 2
2 2nd bit2 True = PCB was produced with auto recovery.
False = PCB was produced normally without auto recovery. 2
2 3rd bit 2 - 2
2 4th bit 2 True = PCB is in transport through mode.
False = PCB was produced. 2
Panel 2 Number of panels within the board. 2
Icons 2 PCB was produced. 2
PCB was produced with auto recovery. 2
Production of PCB was aborted. 2
2 Overview: The user Interface Getting Started with SIPLACE OIS
05/2016 EN Edition Software Version 13.1
16
Description of fields: 2
Number of PCBs: 2
Conveyor Lane Right:Number of PCBs produced on the right conveyor lane. 2
Conveyor Lane Left: Number of PCBs produced on the left conveyor lane. 2
PCB: 2
Best: Shortest assembly time for a PCB in the observation period. 2
Last: Assembly time of last PCB assembled. 2
Prediction The data of the last PCB is used as the basis for calculating the
expected placement rate. 2
Components/h: Current theoretical placement rate for a station.
The number of components placed on the last PCB is offset against the
duration and used to derive the placement rate. 2
PCBs/h: The assembly time of the last PCB is used to derive the expected
number of assembled PCBs per hour. 2
Getting Started with SIPLACE OIS 2 Overview: The user Interface
Software Version 13.1 05/2016 EN Edition
17
2.4 Main View – "Availability" View
2
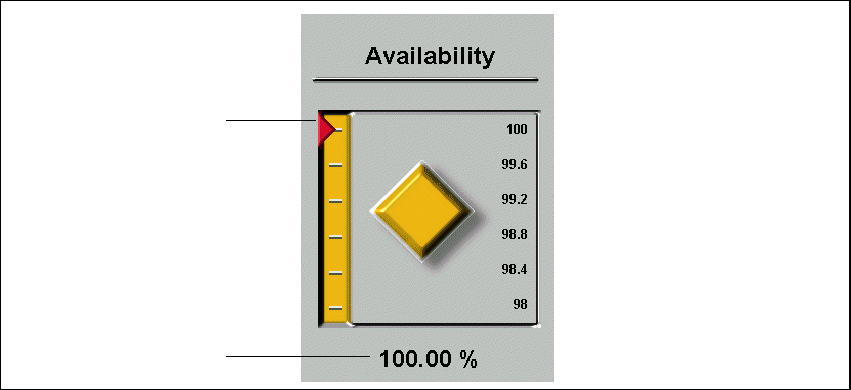
Fig. 2 - 9 Availability
Legend
(1) Graphical representation of availability
(2) Machine availability in %
The display shows the current value for machine availability and indicates whether availability is
remaining constant during operation (diamond), is increasing (up-arrow) or decreasing (down-
arrow). 2
If the calculated availability value falls below a previously defined value (warning limit), this is
indicated by a red or flashing red background. 2
1
2