SIPLACE OIS Version 13.1 Getting Started.pdf - 第19页
Getting Started with SIPLACE OIS 2 Overview: The user Interface Software Version 13.1 05/2016 EN Edition 19 2.4.1 "A vailability" View Click the A vailability button in the main view . The following dialog ap…
2 Overview: The user Interface Getting Started with SIPLACE OIS
05/2016 EN Edition Software Version 13.1
18
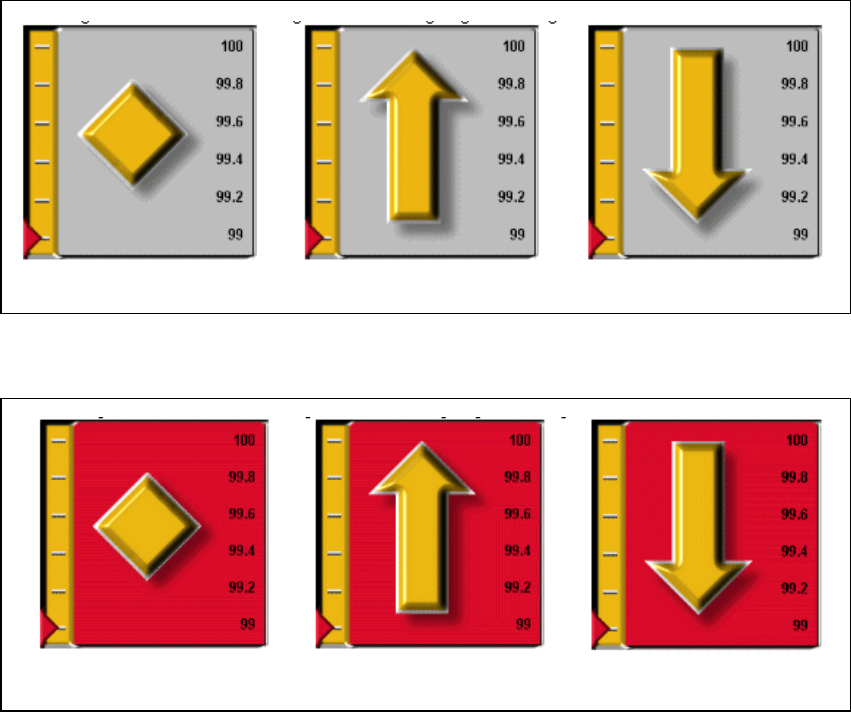
The following representations are possible: 2
The machine availability value lies above the defined warning limit: 2
2
The machine availability value lies below the defined warning limit: 2
2
remains constant is increasing is decreasing
remains constant is increasing is decreasing
Getting Started with SIPLACE OIS 2 Overview: The user Interface
Software Version 13.1 05/2016 EN Edition
19
2.4.1 "Availability" View
Click the Availability button in the main view.
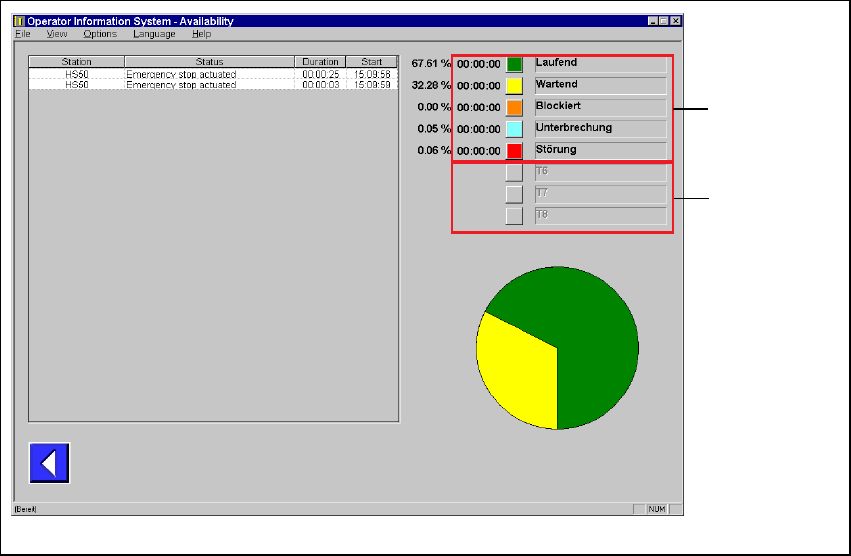
The following dialog appears: 2
2
Fig. 2 - 10 "Availability" dialog
Individual machine states are recorded in list form. 2
These states can be activated when configuring the slices of time. 2
Description of columns: 2
Station Name of the monitored station. 2
Status Specifies the machine status. 2
Duration Length of time the machine was in the specified state. 2
Start Time at which the machine switched to the current state. 2
A pie chart shows the different states of the machine during the observation period. 2
– All slices of time add up to 100%.
Each slice of time (i.e. productive) has a color marking.
– The duration of the respective time slice is displayed considering the chosen observation
period.
Legend
for diagram
Not
used
2 Overview: The user Interface Getting Started with SIPLACE OIS
05/2016 EN Edition Software Version 13.1
20
2.5 Main View – "Reject rate" View
2
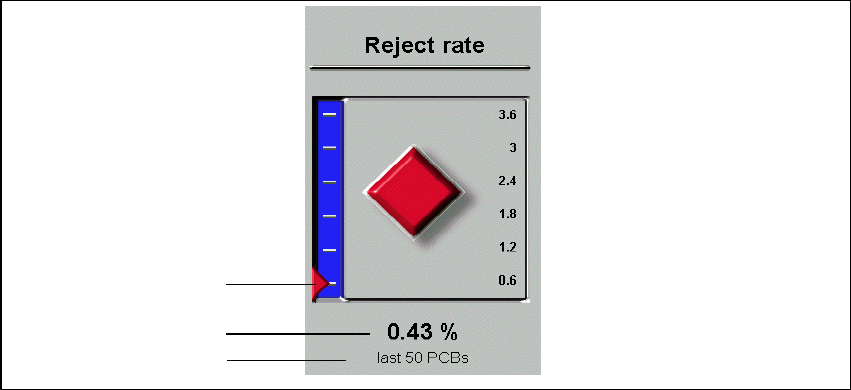
Fig. 2 - 11 Reject rate
Legend
(1) Graphical representation of the reject rate
(2) Reject rate in %
(3) Only visible when the Separate observation period for reject rate check box is activated
in Options--> Monitoring... and a number has been entered in the Most recent PCBs field.
The display shows the current value for the reject rate and indicates whether the rate is remaining
constant during operation (diamond), is increasing (up-arrow), or decreasing (down-arrow). 2
If the calculated reject rate falls below a previously defined value (warning limit), this is indicated
by a red or flashing red background. 2
Warning limits for individual components can be exceeded. This is indicated by a red or flashing
red diamond or arrow icon. 2
1
2
3