SIPLACE OIS Version 13.1 Getting Started.pdf - 第18页
2 Overview: The user Interface Getting Started with SIPLACE OIS 05/2016 EN Edition Software Version 13.1 18 The following representations are possible: 2 The machine availability value lies above the defined warning limi…
Getting Started with SIPLACE OIS 2 Overview: The user Interface
Software Version 13.1 05/2016 EN Edition
17
2.4 Main View – "Availability" View
2
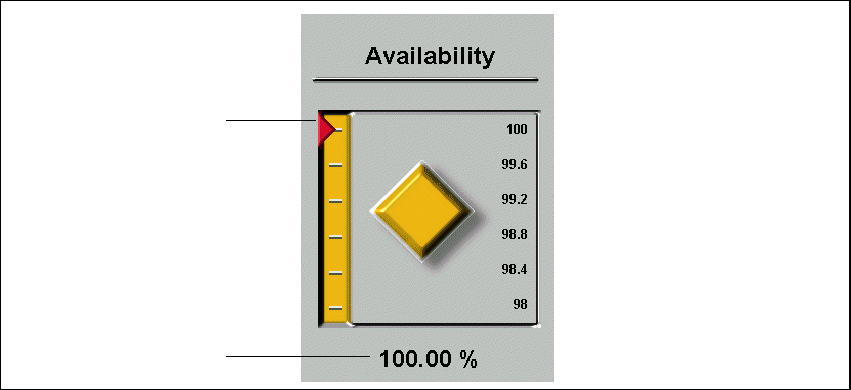
Fig. 2 - 9 Availability
Legend
(1) Graphical representation of availability
(2) Machine availability in %
The display shows the current value for machine availability and indicates whether availability is
remaining constant during operation (diamond), is increasing (up-arrow) or decreasing (down-
arrow). 2
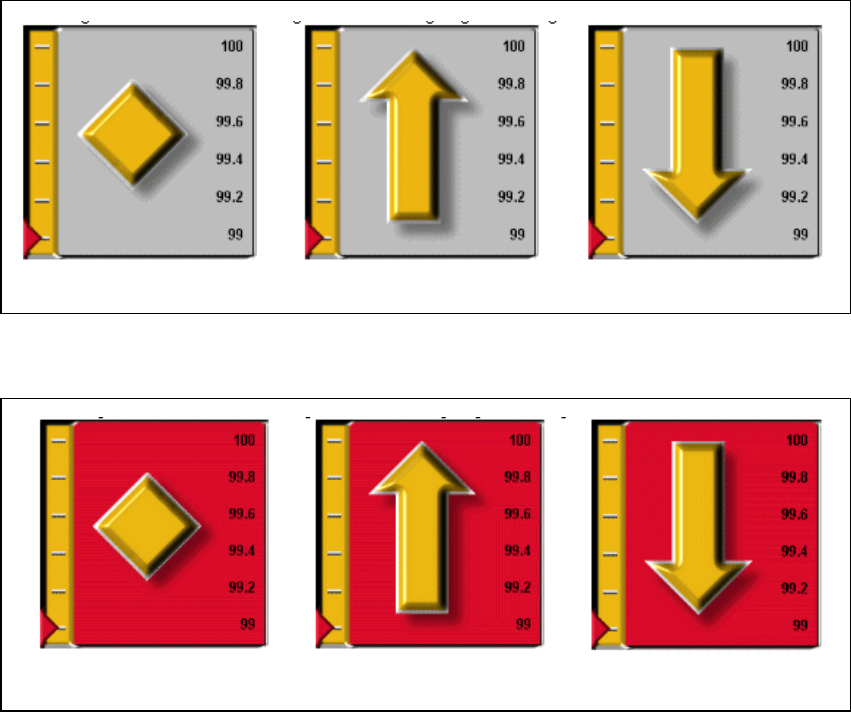
If the calculated availability value falls below a previously defined value (warning limit), this is
indicated by a red or flashing red background. 2
1
2
2 Overview: The user Interface Getting Started with SIPLACE OIS
05/2016 EN Edition Software Version 13.1
18
The following representations are possible: 2
The machine availability value lies above the defined warning limit: 2
2
The machine availability value lies below the defined warning limit: 2
2
remains constant is increasing is decreasing
remains constant is increasing is decreasing
Getting Started with SIPLACE OIS 2 Overview: The user Interface
Software Version 13.1 05/2016 EN Edition
19
2.4.1 "Availability" View
Click the Availability button in the main view.
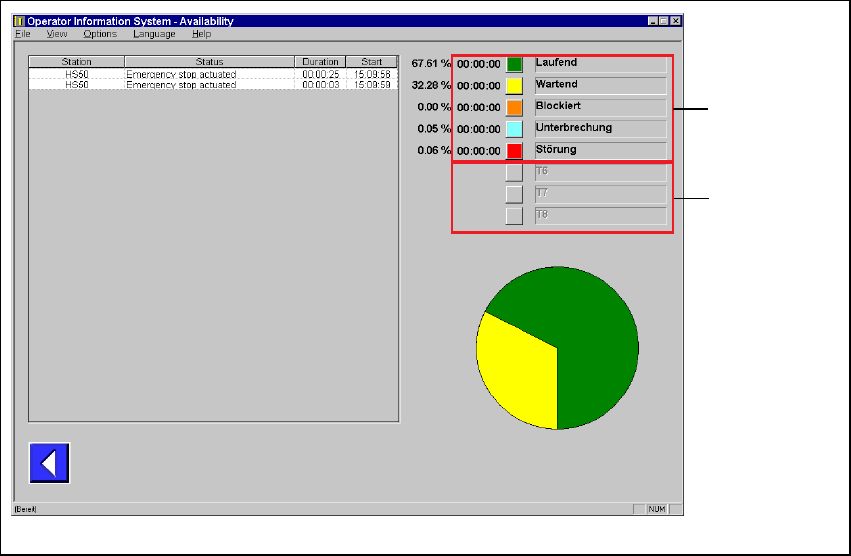
The following dialog appears: 2
2
Fig. 2 - 10 "Availability" dialog
Individual machine states are recorded in list form. 2
These states can be activated when configuring the slices of time. 2
Description of columns: 2
Station Name of the monitored station. 2
Status Specifies the machine status. 2
Duration Length of time the machine was in the specified state. 2
Start Time at which the machine switched to the current state. 2
A pie chart shows the different states of the machine during the observation period. 2
– All slices of time add up to 100%.
Each slice of time (i.e. productive) has a color marking.
– The duration of the respective time slice is displayed considering the chosen observation
period.
Legend
for diagram
Not
used