SIPLACE OIS Version 13.1 Getting Started.pdf - 第23页
Getting Started with SIPLACE OIS 2 Overview: The user Interface Software Version 13.1 05/2016 EN Edition 23 2.5.1 "Hit lists" View Click the Reject rate button in the main view . The following dialog appears:…
2 Overview: The user Interface Getting Started with SIPLACE OIS
05/2016 EN Edition Software Version 13.1
22
The reject rate lies above the defined warning limit. The limit value was exceeded for at least one
error class: 2
2
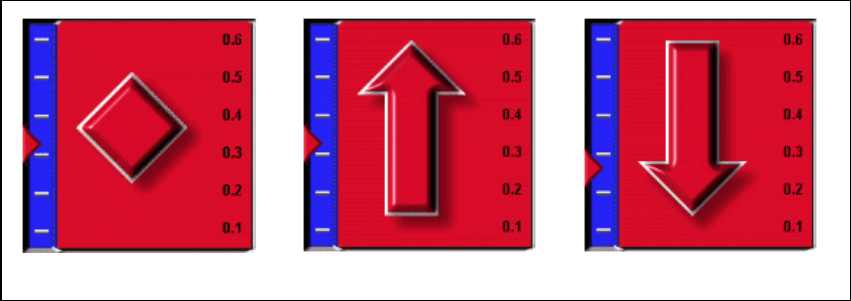
If any of the icons is displayed in red, this indicates that the corresponding error class occurs
repeatedly, i.e. the warning limit defined for the reject rate or for a component has been
exceeded. 2
remains constant is increasing is decreasing
Getting Started with SIPLACE OIS 2 Overview: The user Interface
Software Version 13.1 05/2016 EN Edition
23
2.5.1 "Hit lists" View
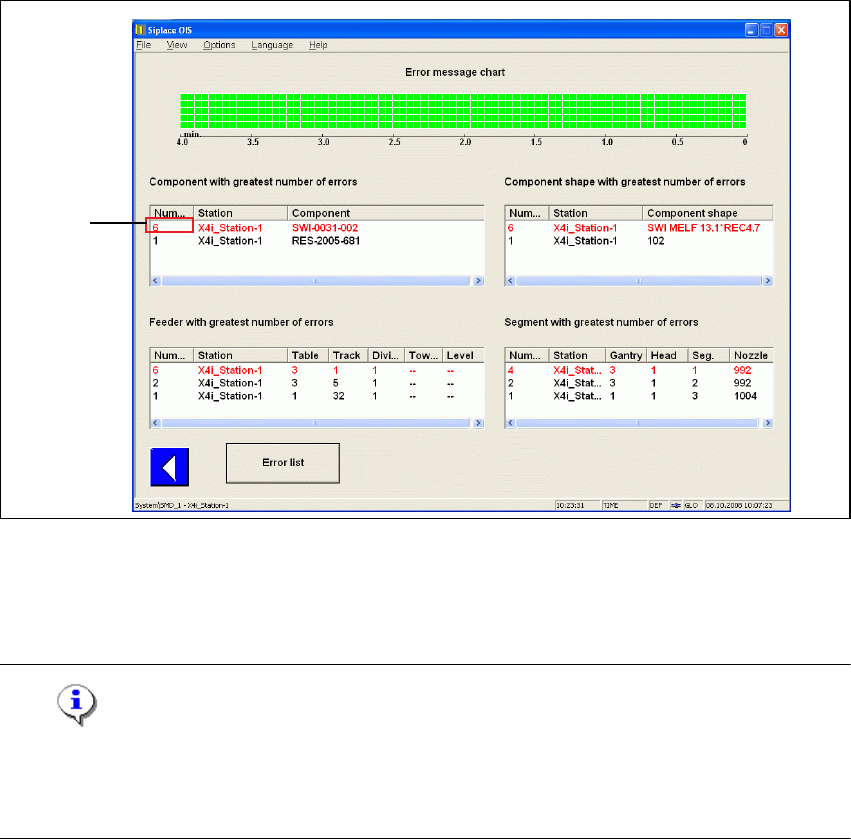
Click the Reject rate button in the main view.
The following dialog appears: 2
2
Fig. 2 - 12 "Hit lists" dialog
The volume of errors is shown in the error message chart in relation to time. For example for the
component SWI-0031-002 at the station X4i_Station-1, 6 error messages are shown. 2
Note
The number of error messages does not always correspond to the number of rejected
components. A rejected component causes at least one but may also cause several error
messages. 2
Representation: 2
A red box is created on the bottom right of the error message chart for each error message. If the
last box is already red, it is entered in the next free line above. No more than 5 errors are
displayed. At intervals of some seconds, all boxes are moved leftward by one box width. The new
errors are then entered in the column at the right-hand margin. The view shows the time during
which several PCBs are assembled. If nozzle or feeder errors occur regularly, a repeating pattern
emerges. After the respective nozzle or feeder has been replaced, this pattern must no longer be
visible. 2
Single
click
2 Overview: The user Interface Getting Started with SIPLACE OIS
05/2016 EN Edition Software Version 13.1
24
Description of fields: 2
Component with greatest number of errors
Shows the three components for which the most error
messages are displayed. 2
Component shape with greatest number of errors
Shows the three component shapes for which the most error
messages are displayed. 2
Feeder with greatest number of errors
Shows the three feeders for which the most error messages
are displayed. 2
Segment with greatest number of errors
Shows the three segments for which the most error
messages are displayed. 2
2.5.1.1 Error Lists
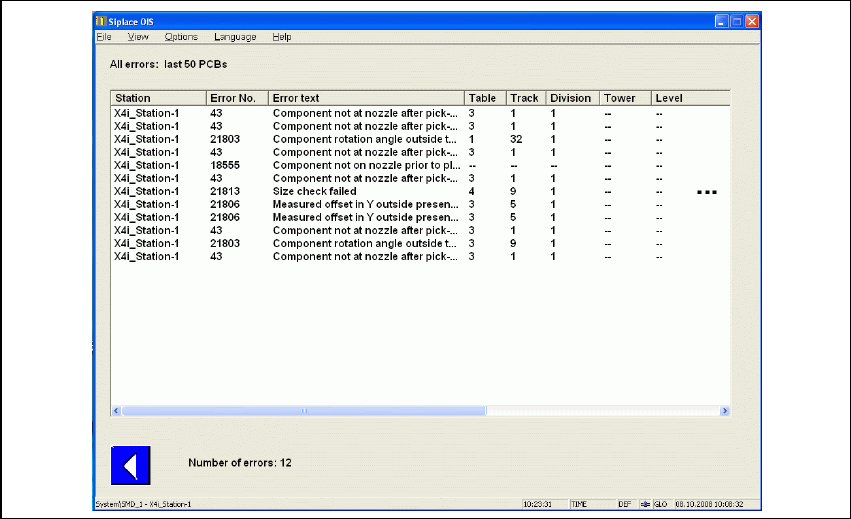
Click the Error lists button in the "Hit lists" dialog.
The following dialog appears: 2
2
Fig. 2 - 13 Detailed view of error lists, part 1