4OM-1011-002.pdf - 第79页
0305-001 Tg0860-PM-MM 3.3.3 Handling Errors Per Feeder Location When the [HANDLING ERRORS PER FDR. LOCA TION] key is pressed at the “MANAGEMENT DA T A (TYPE 1)” display , the following dis- play appears on the screen. Pr…
0305-001 Tg0860-PM-MM
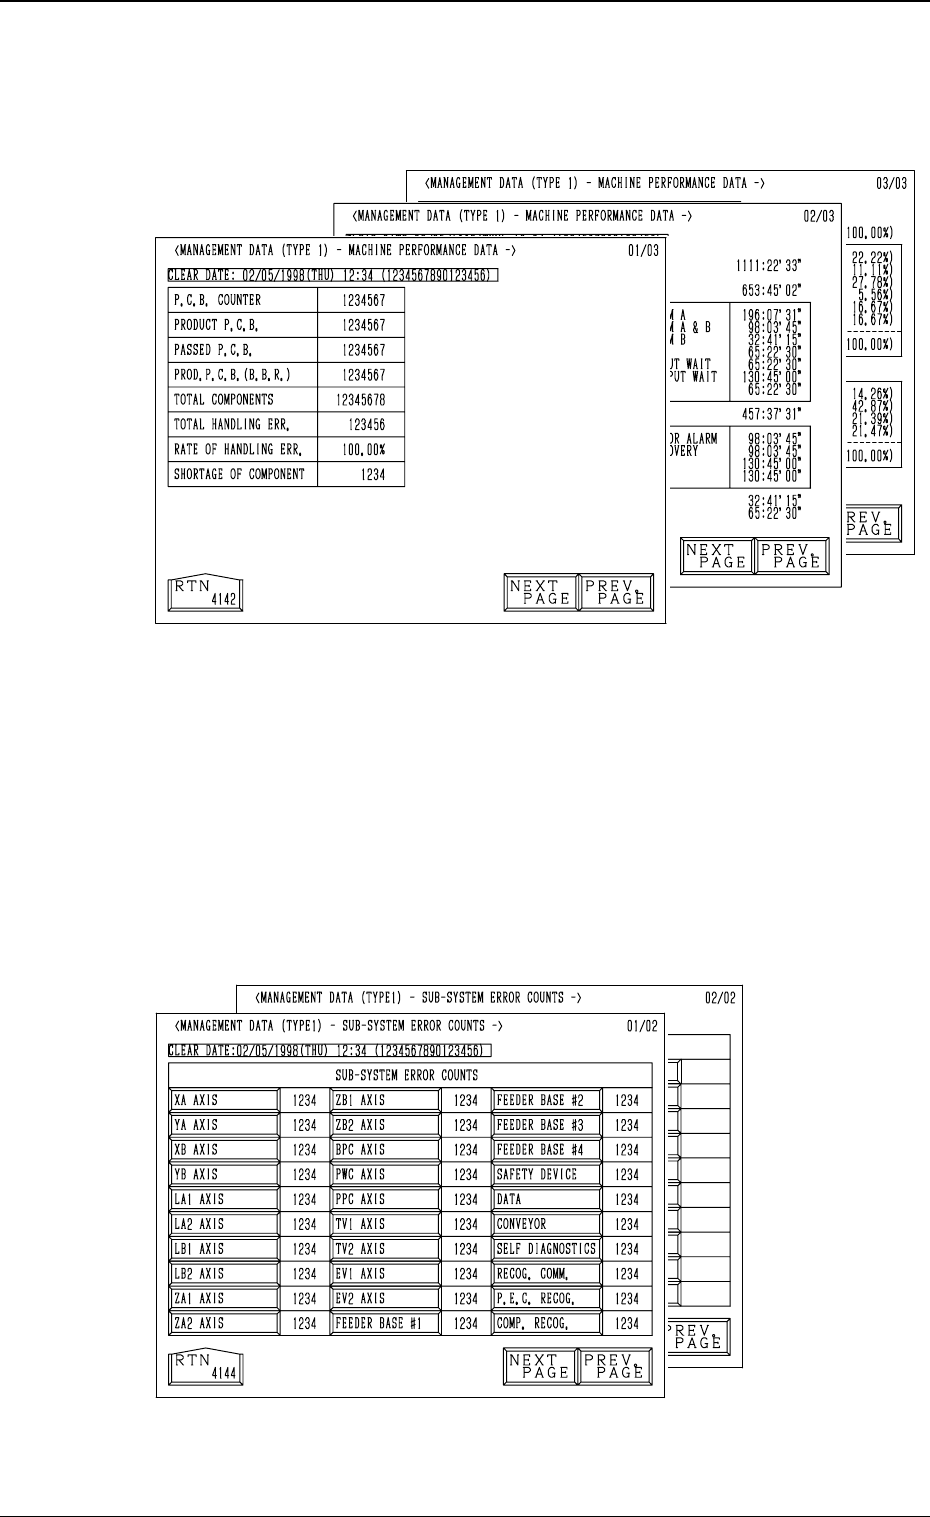
3.3.1 MACHINE PERFORMANCE DATA
When the [MACHINE PERFORMANCE DATA] key is pressed at the “MAN-
AGEMENT DATA (TYPE 1)” display, the following display appears on the
screen.
• This display looks similar to the “PATTERN PROGRAM MANAGEMENT
DATA - MACHINE PERFORMANCE DATA” display. Eachparameter is
based on management data of the machine (not on each pattern program).
(Refer to “3.1 (2) Machine Performance Data” for details.
3.3.2 SUB-SYSTEM ERROR COUNTS
When the [SUB-SYSTEM ERROR COUNTS] key is pressed at the
“MANAGEMENT DATA (TYPE 1)” display, the following display ap-
pears on the screen.
• Shown is the total number of errors which occurred on each device
during automatic operation.
• When each data key is pressed, the corresponding display appears, enabling
the checking of detailed information of the selected device or function where
an error(s) occurred.
3-27
3.3 Management Data (Type 1)
Fig. 4C31
Fig. 4C32
0305-001 Tg0860-PM-MM
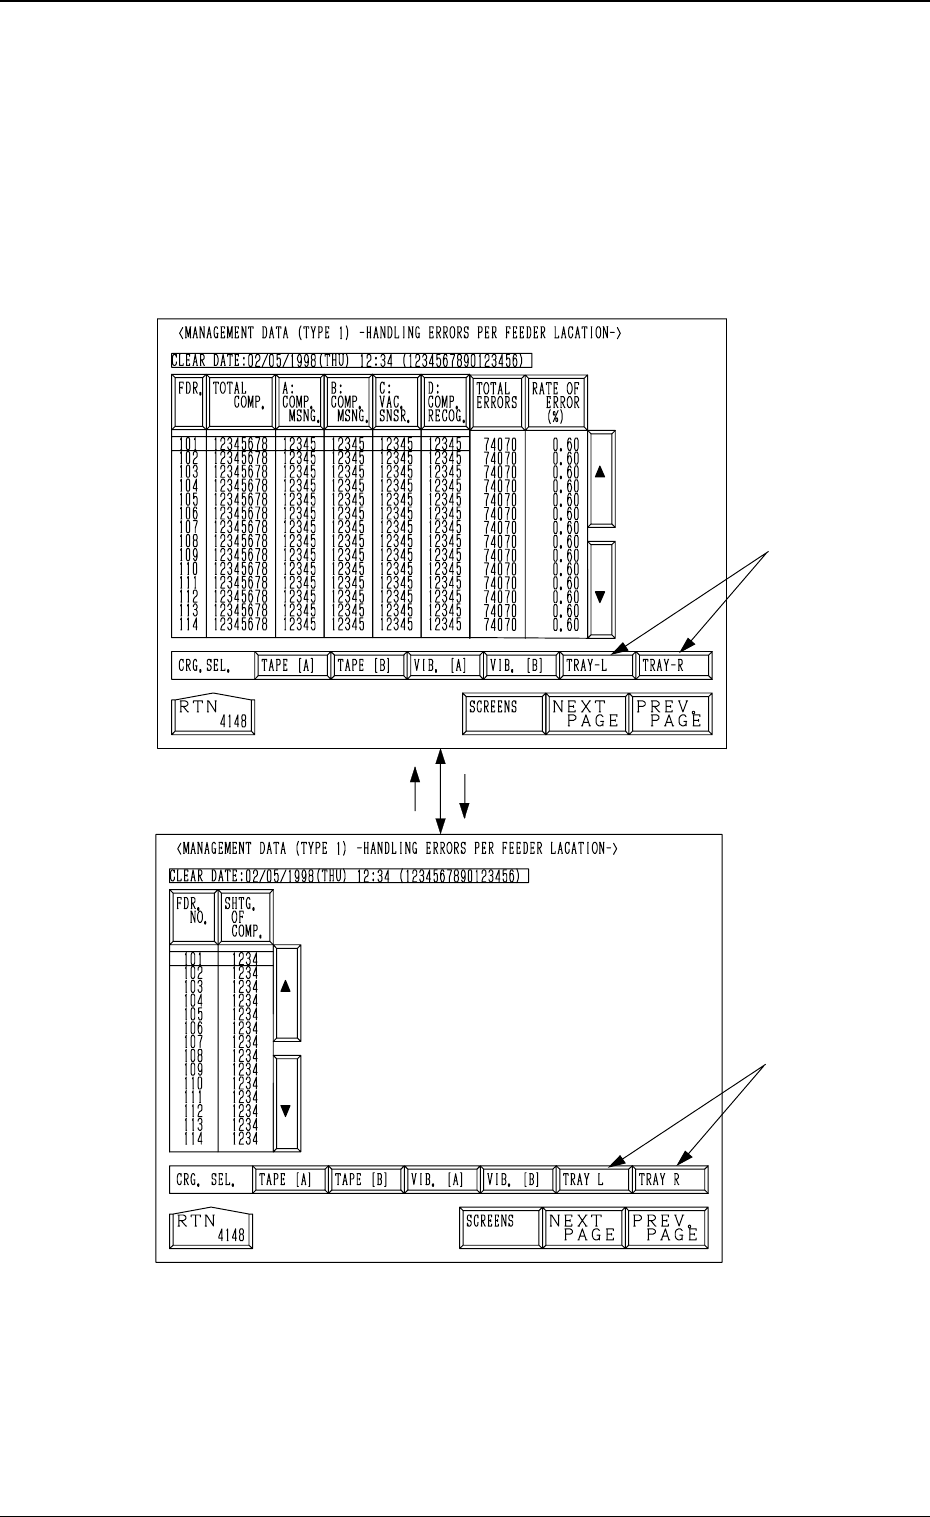
3.3.3 Handling Errors Per Feeder Location
When the [HANDLING ERRORS PER FDR. LOCATION] key is pressed
at the “MANAGEMENT DATA (TYPE 1)” display, the following dis-
play appears on the screen.
Pressing the [SCREENS] key at this display opens another “MANAGE-
MENT DATA (TYPE 1) - HANDLING ERRORS PER FEEDER LOCA-
TION-” display.
Note: The -marked items are optional.
• This display looks similar to the “PATTERN PROGRAM MANAGEMENT
DATA - HANDLING ERRORS PER FEEDER LOCATION” display.
(Refer to “3.1 (3) Handling Errors Per Feeder Location” for details.)
Each parameter is based on management data of the machine (not on each
pattern program).
Fig. 4C33
Fig. 4C34
3-28
3.3 Management Data (Type 1)
[
SCREENS
]
0305-001 Tg0860-PM-MM
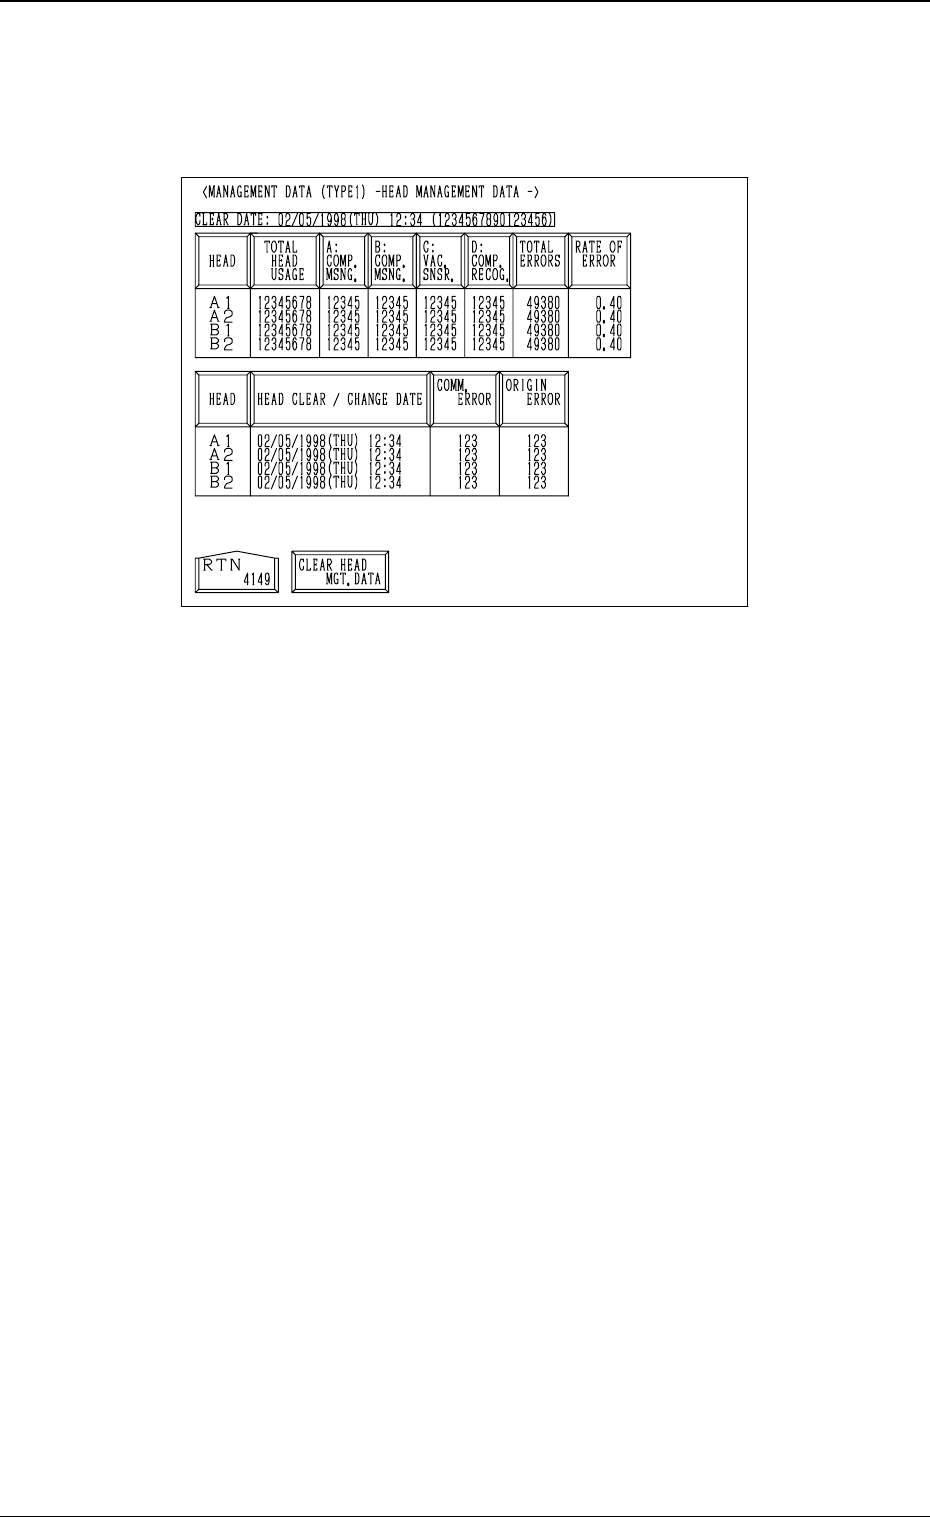
3.3.4 Head Management Data
When the [HEAD MANAGEMENT DATA] key is pressed at the “MANAGE-
MENT DATA (TYPE 1)” display, the following display appears on the screen.
• When one of the data keys is pressed, the feeder No. with the biggest param-
eter under the selected data key is displayed in the first line and feeder Nos.
having the subsequent (second, third, fourth, ...) biggest parameters follow.
When the [HEAD] key is pressed, head Nos. are arranged in their initial
order.
[HEAD] Key
Shown are the head Nos. (A1, A2, B1, B2).
[TOTAL HEAD USAGE] Key
Shown is the number of picked components.
[A: COMP. MSNG.] Key
Shown is the number of missing components detected by the vacuum sen-
sor.
[B: COMP. MSNG.] Key
Shown is the number of missing components detected in the recognition
processing.
[C: VAC. SNSR.] Key
Shown is the total number of component pick-up errors detected by the
vacuum sensor (errors not detected through the component recognition) for
each individual feeders.
[D: COMP. RECOG.] Key
Shown is the number of component recognition errors.
[TOTAL ERRORS] Key
Shown is the total number of errors detected by the above-described func-
tions ([A: COMP. MSNG.] through [D: COMP. RECOG.] keys).
[RATE OF ERROR] Key
Shown are the error rates compared with the number of picked compo-
nents.
3-29
3.3 Management Data (Type 1)
Fig. 4C35