IPC-TM-650 EN 2022 试验方法1.pdf - 第20页
T a ble 3: G ood Parts That Were Rejected Score a ‘‘1’ ’ where good parts were rejected in T able 1 above. Score a ‘‘0’ ’ e verywhere else. Note the scores for each tester in the table below . T ester Samples 1 2 3 4 5 6…
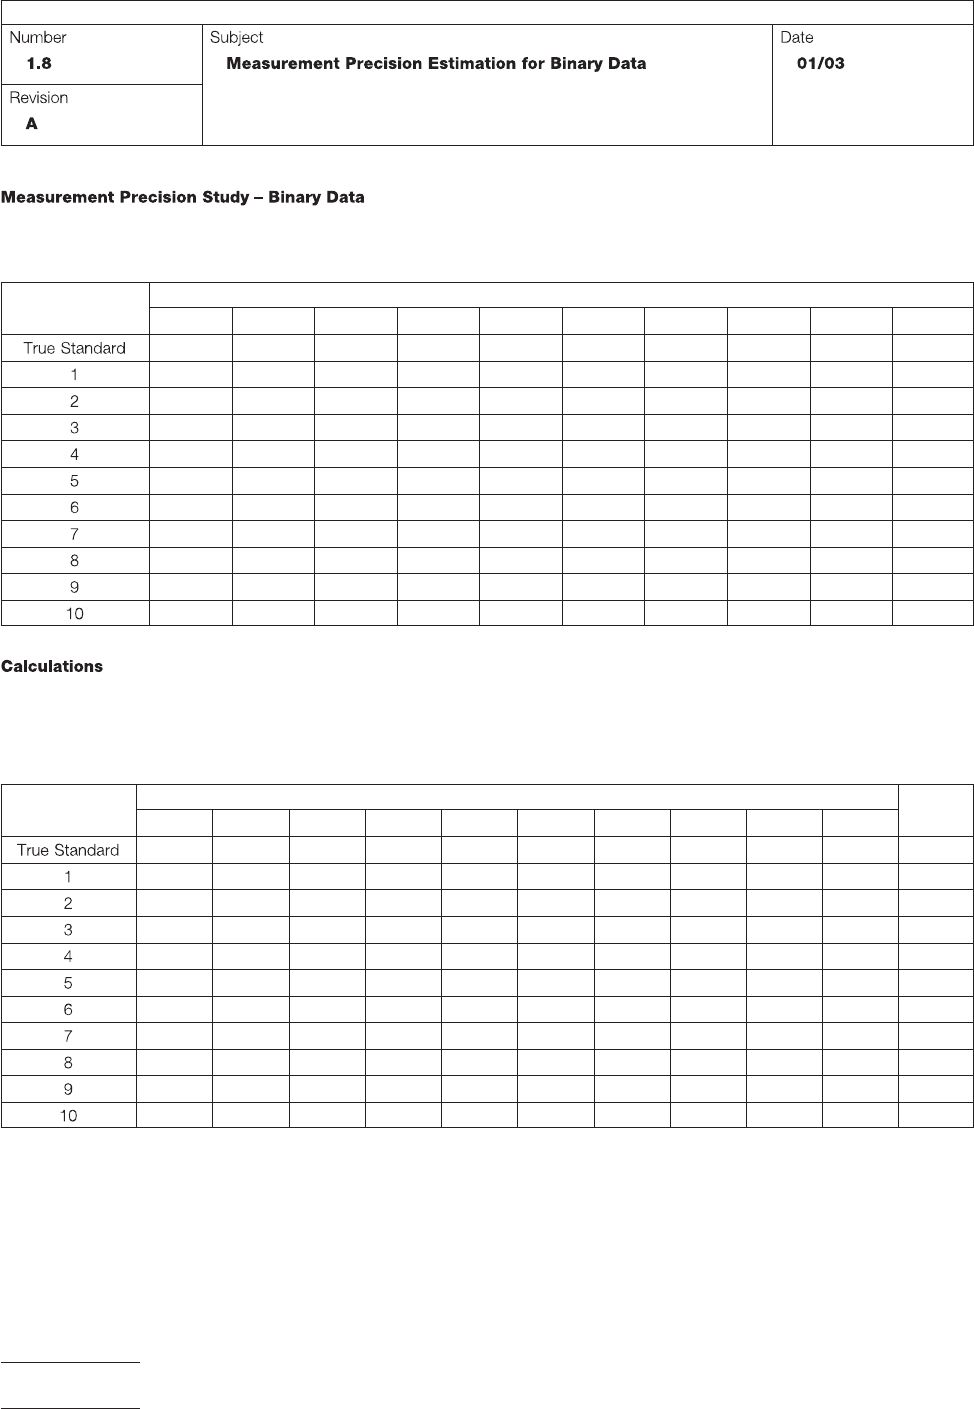
Table 1: Data Entry Form
Enter test results into the table below.
Tester
Samples
1 2 3 4 5 6 7 8 9 10
Table 2: Samples Dispositioned Correctly
Score a ‘‘1’’ where disposition in Table 1 above matched the true standard.
Score a ‘‘0’’ where disposition did not match the true standard.
Note these scores for each of the testers in the table below.
Tester
Samples
1 2 3 4 5 6 7 8 9 10 Total
IPC-TM-650
Page 4 of 6
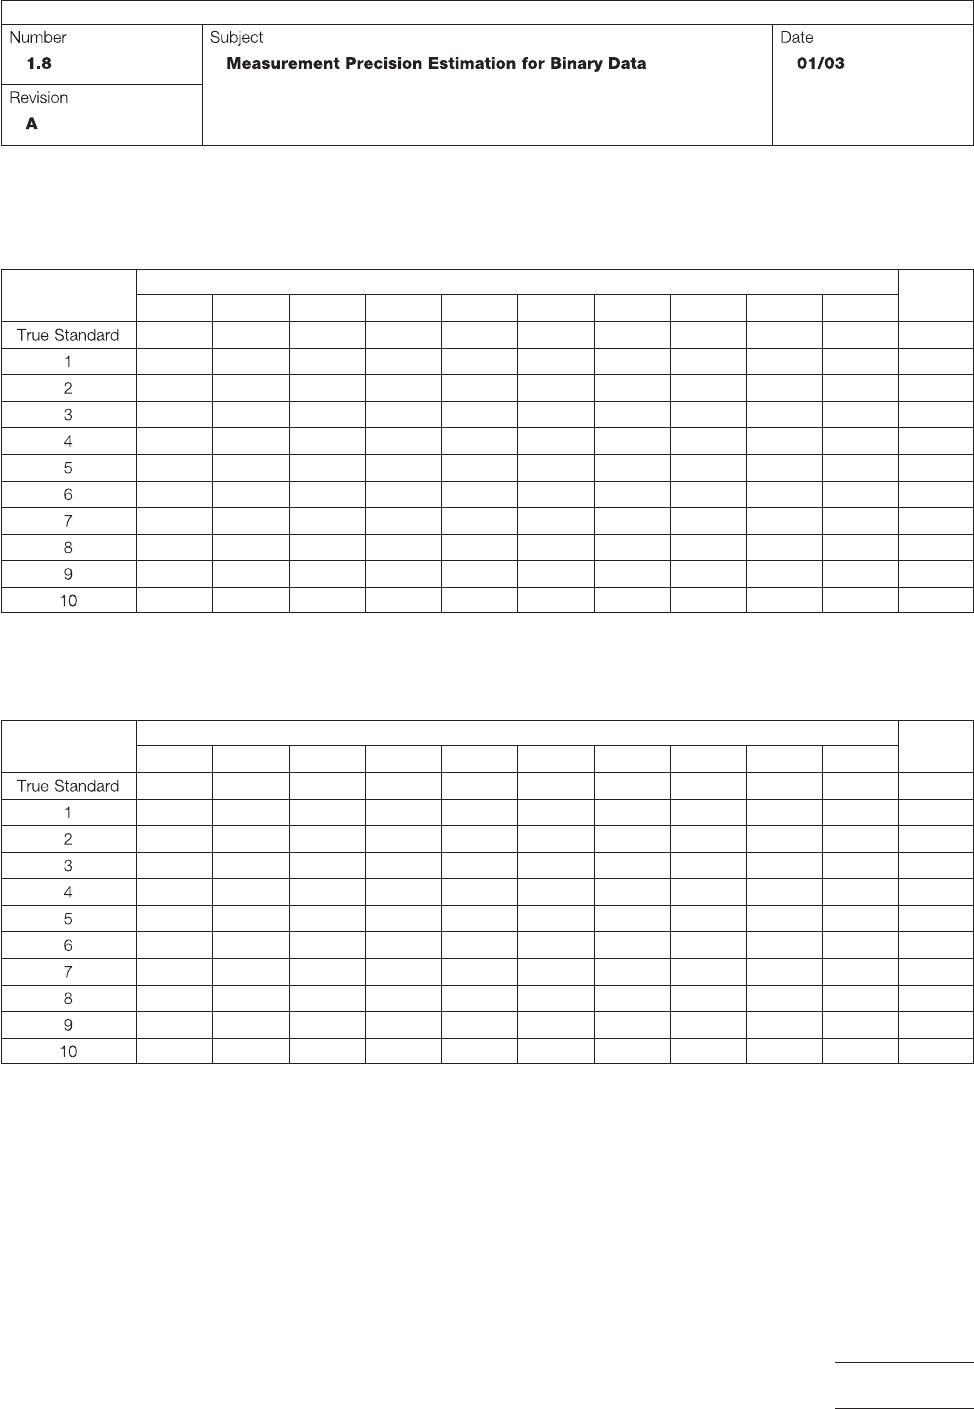
Table 3: Good Parts That Were Rejected
Score a ‘‘1’’ where good parts were rejected in Table 1 above.
Score a ‘‘0’’ everywhere else.
Note the scores for each tester in the table below.
Tester
Samples
1 2 3 4 5 6 7 8 9 10 Total
Table 4: Bad Parts That Were Accepted
Score a ‘‘1’’ where bad parts were accepted in Table 1 above.
Score a ‘‘0’’ everywhere else.
Tester
Samples
1 2 3 4 5 6 7 8 9 10 Total
IPC-TM-650
Page 5 of 6
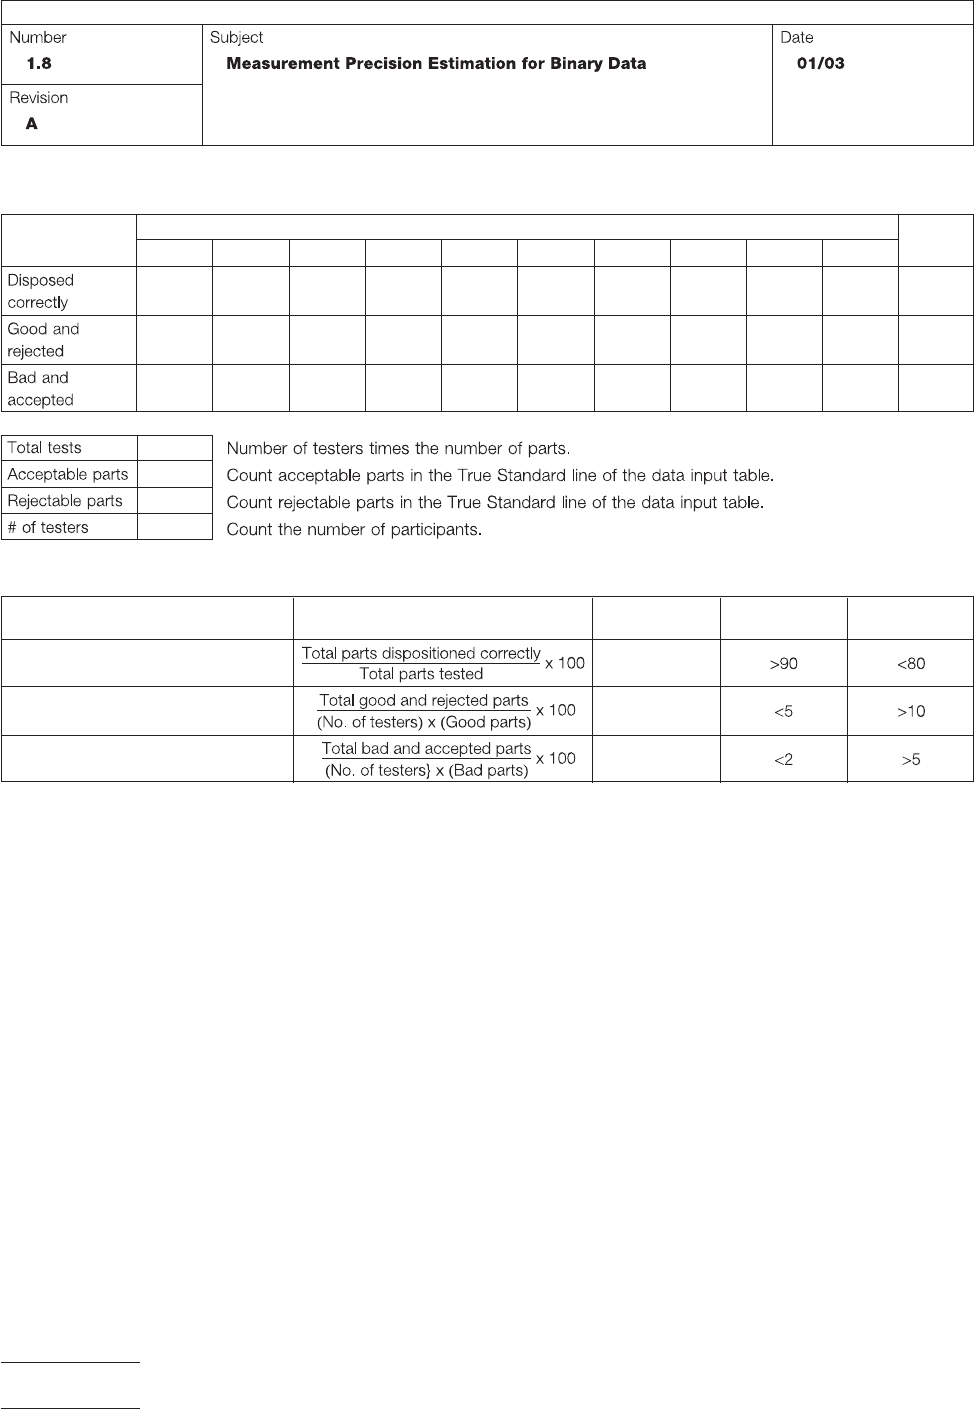
Table 5: Measurement System Scorecard
Results
Tester
1 2 3 4 5 6 7 8 9 10 Total
Table 6: Measurement System Effectiveness
Metric Calculation Result Acceptable
Needs
Improvement
Test effectiveness (%)
Probability of false rejects (%)
Probability of false acceptance (%)
IPC-TM-650
Page 6 of 6