IPC-TM-650 EN 2022 试验方法1.pdf - 第553页
IPC-TM-650 Number Subject Da te Revision Page 3 of 7 2.5.5.15 RelativePermittivityandLossTangentUsinga 06/22 Split-PostDielectricResonator N/A 4 Apparatus or Material 4.1 Test System The schematic diagra…
IPC-TM-650
Number Subject Date
Revision
where
h
g
is the distance between the metal enclosures of the fixture;
D is internal diameter of the metal enclosures;
L is internal height of the metal enclosures;
d
r
is the diameter of the dielectric resonator;
h
r
is the thickness of the dielectric resonator.
3.3 Specimen Thickness
The thicker the specimen the less error occurs in the measurements. A thin specimen may be stacked
up to a minimum of 0.4 mm [0.016 in] to improve measurement accuracy. The air gaps between the sample and the fixture do
not affect the measurement.
3.4 Number of Specimens
Three specimens for the test at room temperature and one specimen for the test at variable temperatures
are required for each SPDR test fixture for this test. Table 1 shows the supported specimen dimensions
Table 1 – Specimen Dimensions
NominalFrequency[GHz]
SpecimenSizes
mm[inch]
MaximumThickness
mm[inch]
1 150 X 150 [5.9 X 5.9] 6.0 [0.24]
3 80 X 80 [3.2 X 3.2] 3.0 [0.12]
5 to 6 80 X 80 [3.2 X 3.2] 2.0 [0.08]
9 to 10 80 X 80 [3.2 X 3.2]
0.9 [0.035]
13 to 16 50 X 35 [2.0 X 1.4] 0.6 [0.024]
18 to 20 15 X 15 [0.6 X 0.6] 0.5 [0.020]
2.5.5.15
RelativePermittivityandLossTangentUsinga
06/22
Split-PostDielectricResonator
N/A
Page 2 of 7
IPC-TM-650
Number Subject Date
Revision
Page 3 of 7
2.5.5.15
RelativePermittivityandLossTangentUsinga
06/22
Split-PostDielectricResonator
N/A
4 Apparatus or Material
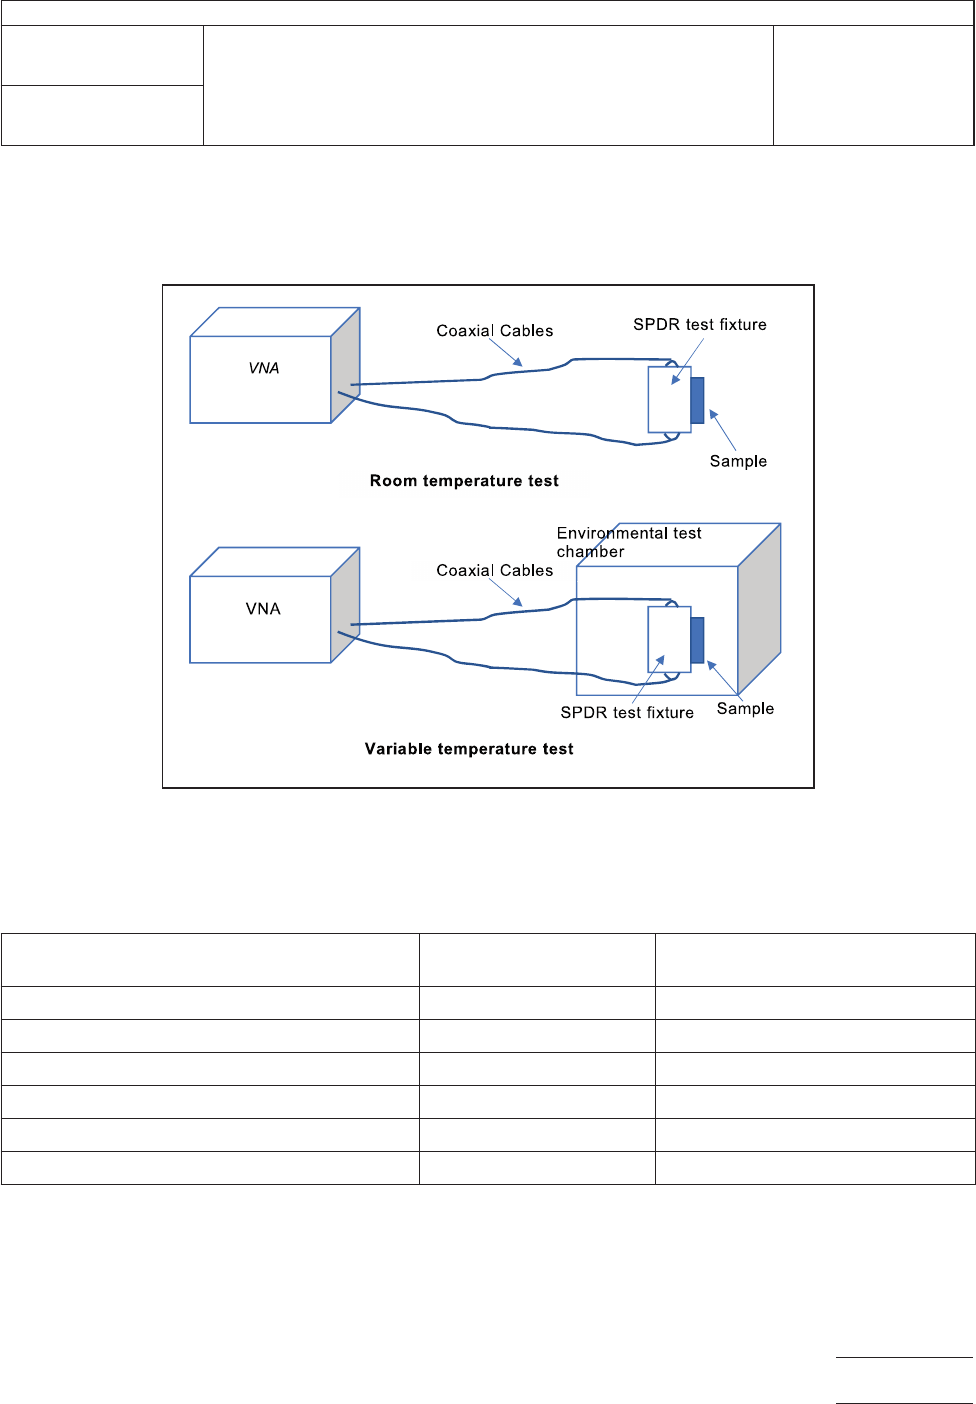
4.1 Test System
The schematic diagram of the test system is shown in Figure 2. The test can be conducted at room temperature
or an elevated temperature as indicated.
Figure2–SchematicDiagramofTestSystem
4.2 Test Fixture Parameters
Table 2 shows the typical relationship between the SPDR test fixture’s nominal frequency and
h
g
and D. For different test frequencies, the corresponding SPDR test fixture of nominal frequency shall be used.
Table 2 – Test Fixture Configurations
SPDRTestFrequency
[GHz]
D
mm[inch]
hg
mm[inch]
1 120 [4.7] 6.0 [0.24]
3 50 [2.0] 3.0 [0.12]
5 to 6 30 [1.2] 2.0 [0.08]
9 to 10 22 [0.9] 0.9 [0.035]
13 to 16 15 [0.6] 0.6 [0.024]
18 to 20 10 [0.4] 0.5 [0.020]
4.3 Vector Network Analyzer (VNA)
The frequency range of the VNA shall be 500 MHz to 20 GHz, The dynamic range of the
VNA shall be more than 60 dB.
4.4 Calibration Reference
The calibration equipment shall include a standard reference sample. For example, a single-crystal
quartz or equivalent reference, and a calibration assembly for the VNA.