3OM-1208-011_w.pdf - 第195页
5-8 AIVEDT -ID [2] Icons Described below is the meaning of each icon that will be used only in the "Management Data" window . Reference Refer to "1.2 Basic Icons" in "Chapter 2" for the mean…
5-7
AIVEDT-ID
2. Management Data
The corresponding window enables the operator to confirm the production
performance data covering the whole machine performance.
Note
The contents of "Type #1" are almost the same as "Type #2".
To use the required items, the management spans must be distinguished.
When the [Manage Dt.] button is pressed in the "MANAGEMENT DATA"
window, the "Management Data - [manage (Type1)]" window opens.
[3][2][1]
[4]
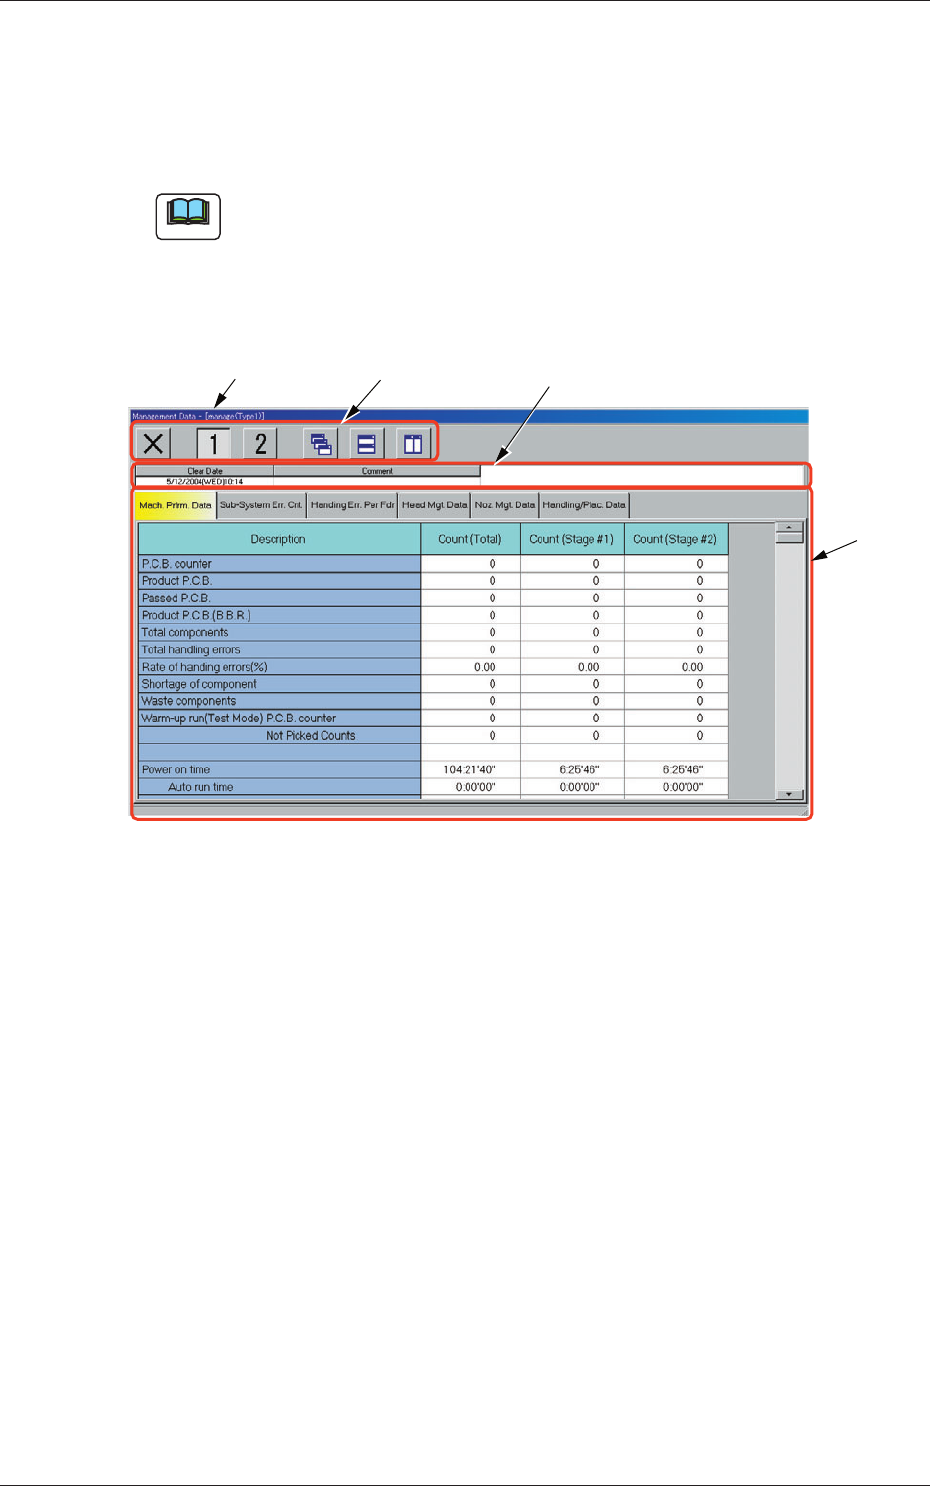
Fig. 3E5 "Management Data" Window
[1] Title Bar
The active window is titled "Management Data - [manage (Type1 or
Type2)]" on this bar, making it clear which data (Type #1 or #2) is
selected.
2. Management Data
0606-009
5-8
AIVEDT-ID
[2] Icons
Described below is the meaning of each icon that will be used only in
the "Management Data" window.
Reference
Refer to "1.2 Basic Icons" in "Chapter 2" for the meaning of the basic
icons.
: When pressed, this opens the "Management Data -
[manage(Type1)]" window.
: When pressed, this opens the "Management Data -
[manage(Type2)]" window.
[3] Information on Active File
This field displays "Clear Date" and "Comment".
[4] Tabs and Tab Sheets
The "Management Data" window is provided with the following six
tabs. When each tab is pressed, the corresponding tab sheet appears
inside the window.
Table 3E2
Tabs Description
Machine Performance Data
The corresponding tab sheet enables the operator to view various
counts (results of accumulated data) as machine performance data.
Sub-System Error Counts
The c
orresponding tab sheet enables the operator to view the summed
number of errors that occurred on each individual devices during
automatic operation.
Handling Errors Per Feeder
The corresponding tab sheet enables the operator to view the pickup
data of each individual feeders.
Head Management Data
The corresponding tab sheet enables the operator to view various
counts (results of accumulated performance data) of each individual
heads.
Nozzle Management Data
The corresponding tab sheet enables the operator to view various
counts (results of accumulated performance data) of each individual
nozzles.
Handling/Placement Data
The corresponding tab sheet enables the operator to view the
component pickup and placement data.
2. Management Data
0606-009
5-9
AIVEDT-ID
2.1 Machine Performance Data
0606-009
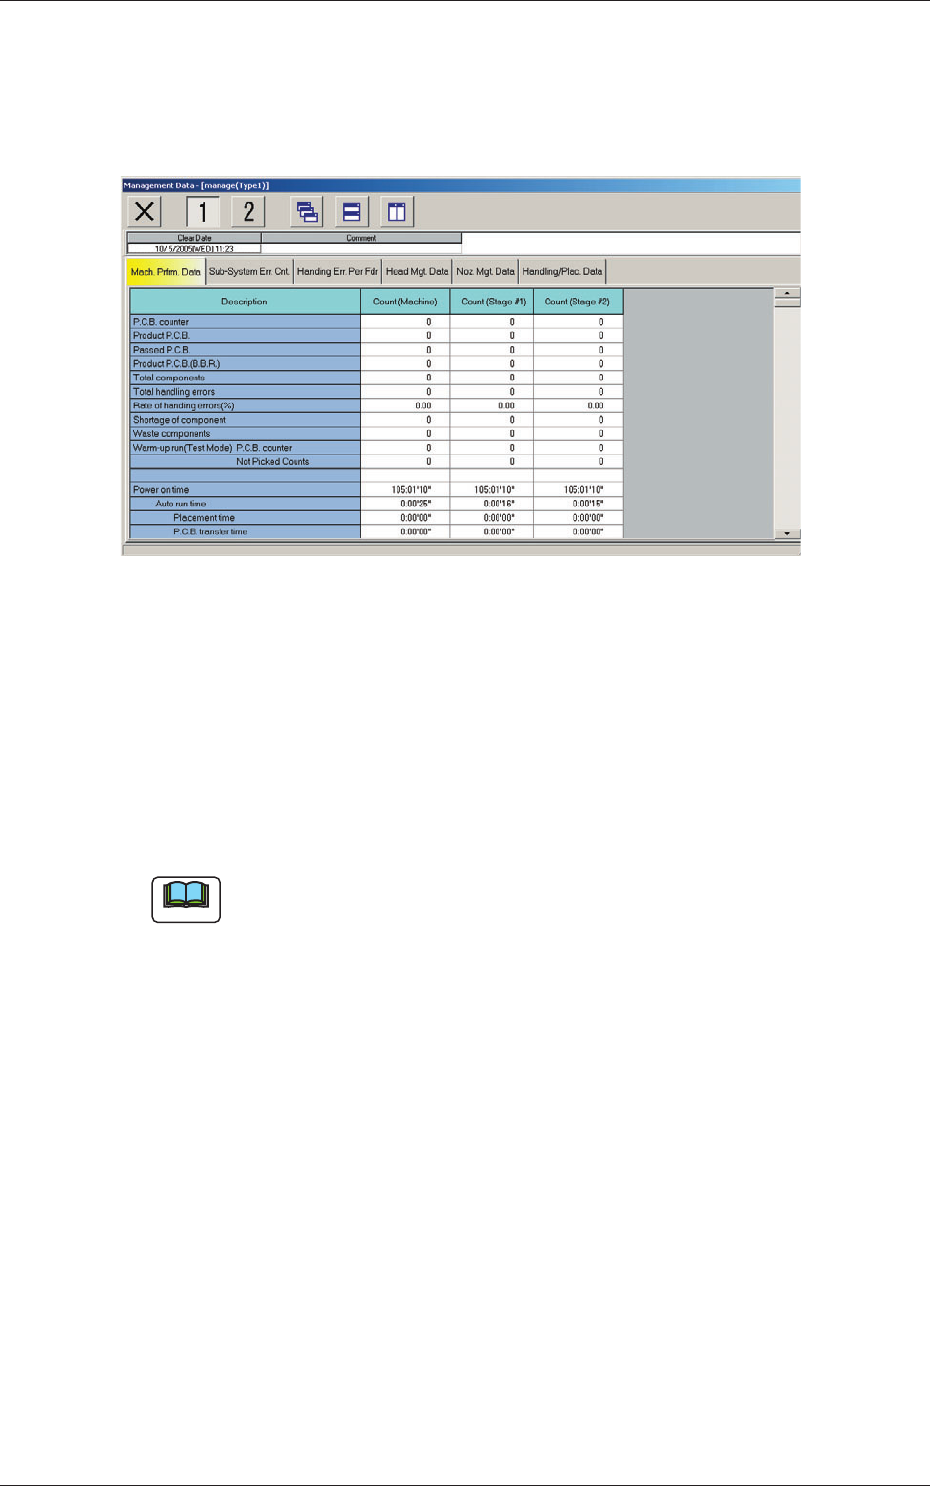
2.1 Machine Performance Data
When the "Mach. Prfrm. Data" tab is pressed in the "Management Data"
window, the following tab sheet appears inside the window.
Fig. 3E6 "Mach. Prfrm. Data" Tab Sheet
Displayed is the list of counted numbers (total counts included) for each
individual data items related to "Stage #1" and "Stage #2".
(1) PCB counter
Shown is the number of produced PCBs.
Counting is implemented when the X/Y table is zeroed after component
placement operation (when a PCB is finished).
Note
When a particular pattern program is set several times as current one, the
sum total is computed.
(2) Product PCB
The number of produced unit PCBs on multi-unit PCB is summed up.
Counting is implemented when the X/Y beam is zeroed after component
placement operation (when a unit is finished).
When the bad board reject (BBR) function is used, defective unit PCBs
are excluded.
(3) Passed PCB
The number of passed PCBs is counted when the machine is set in the
"PASS" mode.
Counting is implemented when the PCB transfer starts (when the PCB
on the PCB positioning section is transferred to the output conveyor).