AOI_RS_v85_en.pdf - 第113页
Chap ter3 SPC User Ma nual AOI Repair Station 109 a. T ake the above graph for example, the V -USL of G1 in “Spec Data” is the average of upper spec limit of “C1_1” and “C10_1”. And V -Standard and V -LS L data of G1a re…
Chapter3 SPC User Manual
AOI Repair Station
108
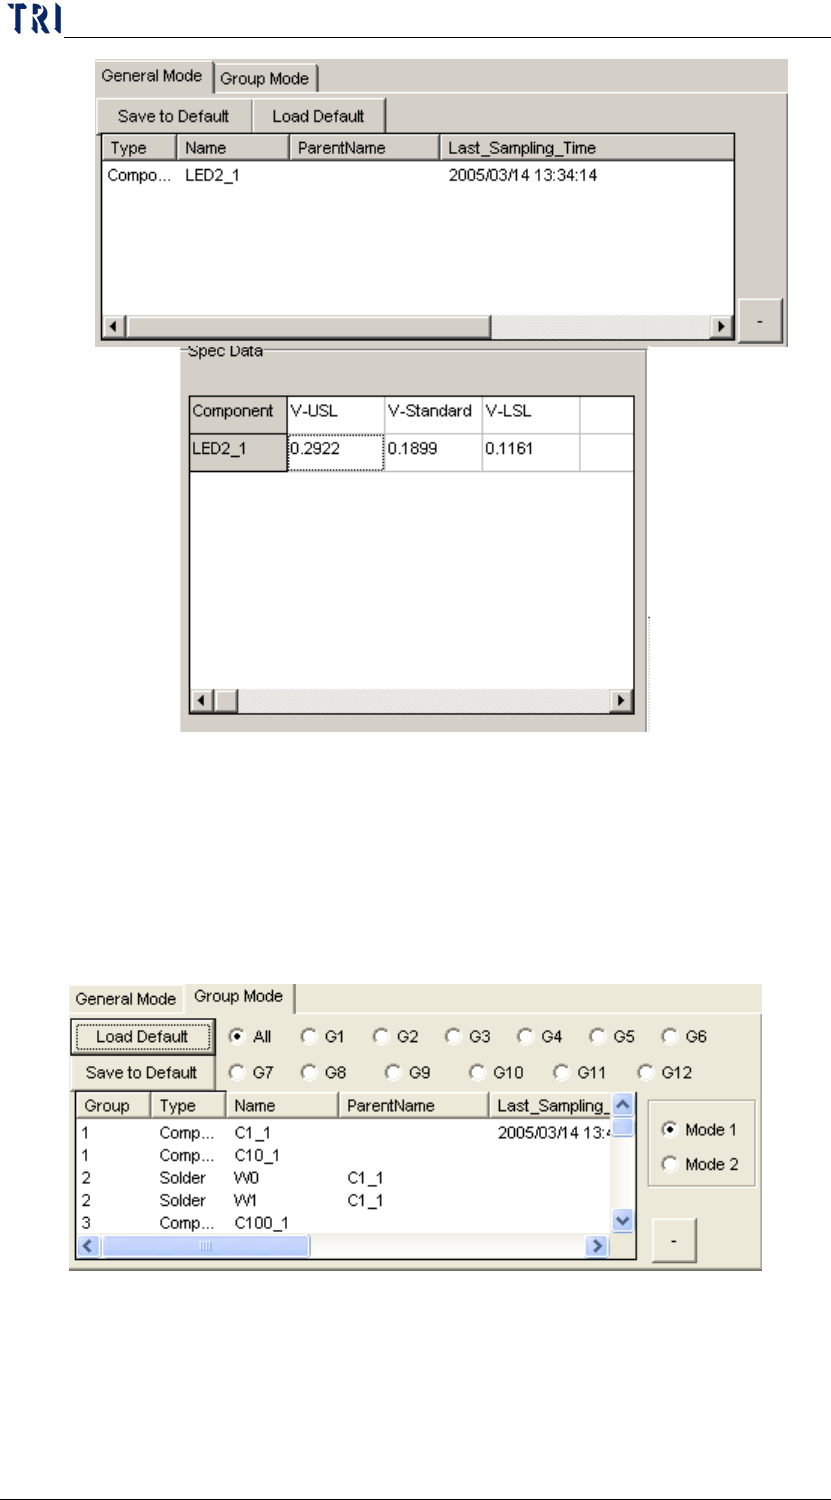
a. Take the above graph for example, the V-USL, V-Standard and
V-LSL data displayed in “Spec Data” are the upper spec limit,
standard deviation and lower spec limit of “LED2_1”.
Group Mode: If you select the Group Mode, the displayed spec data is
the average of upper spec limit, lower spec limit and the standard
deviation of the monitoring items in the group.
Chapter3 SPC User Manual
AOI Repair Station
109
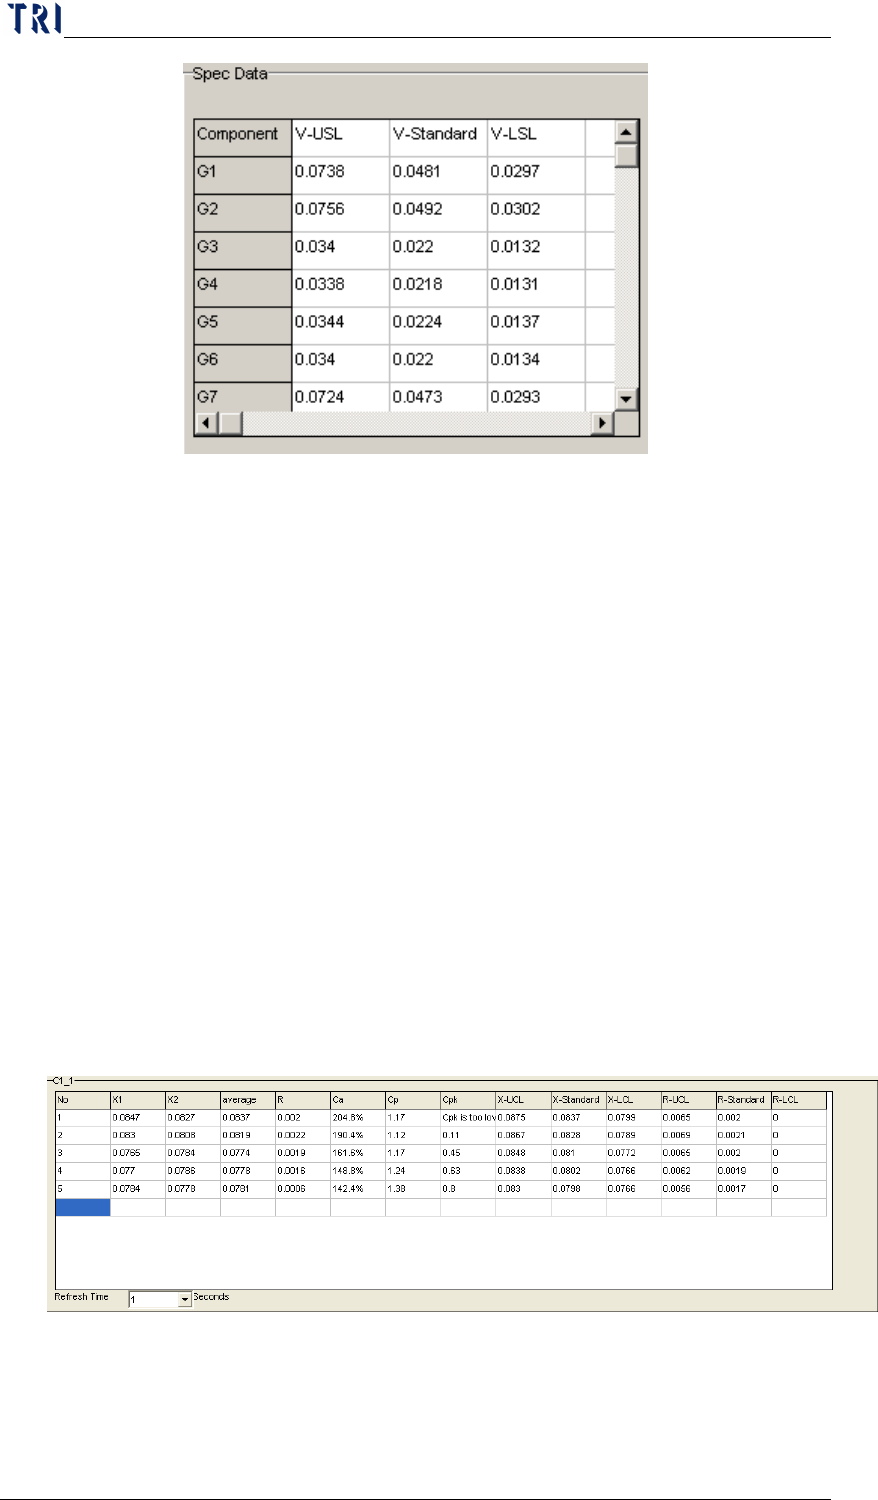
a. Take the above graph for example, the V-USL of G1 in “Spec
Data” is the average of upper spec limit of “C1_1” and
“C10_1”. And V-Standard and V-LSL data of G1are also the
standard deviation average and lower spec limit average of
“C1_1” and “C10_1”.
There is more instruction for the two models in Real-time monitor
setup area.
7.3.4 Real-time monitor statistics data: This area displays the real-time
monitor item sampling data and the relevant statistical data located in
the left and right SPC Data blocks in the middle of the screen as shown
below. There are some differences for different control chart you select;
separately explains as the followings.
X bar R Chart: If a user selects X bar R Chart, the statistic data
are as the followings.
Every fields are explained below:
a. X1、X2…Xn: Sample data. For AOI, user can select X (X
shift), Y(Y Shift) and, Theta (rotate angle). For SPI, user can

Chapter3 SPC User Manual
AOI Repair Station
110
select V (Volume), A (Area), H (Height), PX (X Shift) and PY
(Y Shift). If user select X, it means the X shift of the selected
component. The number of sample is according to the
sample size user set. For example, if the sample size is 5, it
displays X1, X2, X3, X4 and X5.
b. Average: Average. Add the all number in X1, X2, …, Xn field
together, then divide it by sample size. For example, if the
sample size is 5, the value will be (X1+X2+X3+X4+X5)/5.
c. R: Range. The maximum in X1~Xn subtract the minimum in
X1~Xn.
d. Ca: Process Accuracy. The formula is as the following.
Ca=((X bar-Spec Center)/(Spec Tolerance)/2)*100%
Spec Tolerance=USL-LSL
Spec Center=(USL-LSL)/2
e. Cp: Process Capability.
f. Cpk: Process Capability Index.
g. X-UCL: Upper Control Limit of X-bar chart.
h. X-Standard: Control Center Line of X-bar chart.
i. X-LCL: Lower Control Limit of X-bar chart.
j. R-UCL: Upper Control Limit of R chart.
k. R-Standard: Control Center Line of R chart.
l. R-LCL: Lower Control Limit of R chart.
m. Formula: