AOI_RS_v85_en.pdf - 第117页
Chap ter3 SPC User Ma nual AOI Repair Station 1 13 7.3.5 Control display ar ea: Below the statistical data are the control chart display areas. These areas are located in the graphics dis play area on the left and right …
Chapter3 SPC User Manual
AOI Repair Station
112
b. Defect Rate: The formula is:
Defect Rate=Defect Count/Subgroup Size
c. Subgroup Size: Sample size
d. UCL: Upper Control Limit of P chart.
e. Standard: Control Central Line of P chart.
f. LCL: Lower Control Limit of P chart.
g. Formula
P
Line
Central
Control
n
PP
PLCL
n
PP
PUCL
m
p
P
ratedefectsamplesp
samplingpersizesamplem
smplingofsetameansgroupasizegroupn
m
i
i
i
)1(
3
)1(
3
,
) (
1
−
−=
−
+=
=
⇒
⇒
⇒
∑
=
Chapter3 SPC User Manual
AOI Repair Station
113
7.3.5 Control display area: Below the statistical data are the control chart
display areas. These areas are located in the graphics display area on
the left and right side at the bottom of the screen. The different kinds of
control chart will display different graph for each monitored
component or solder.
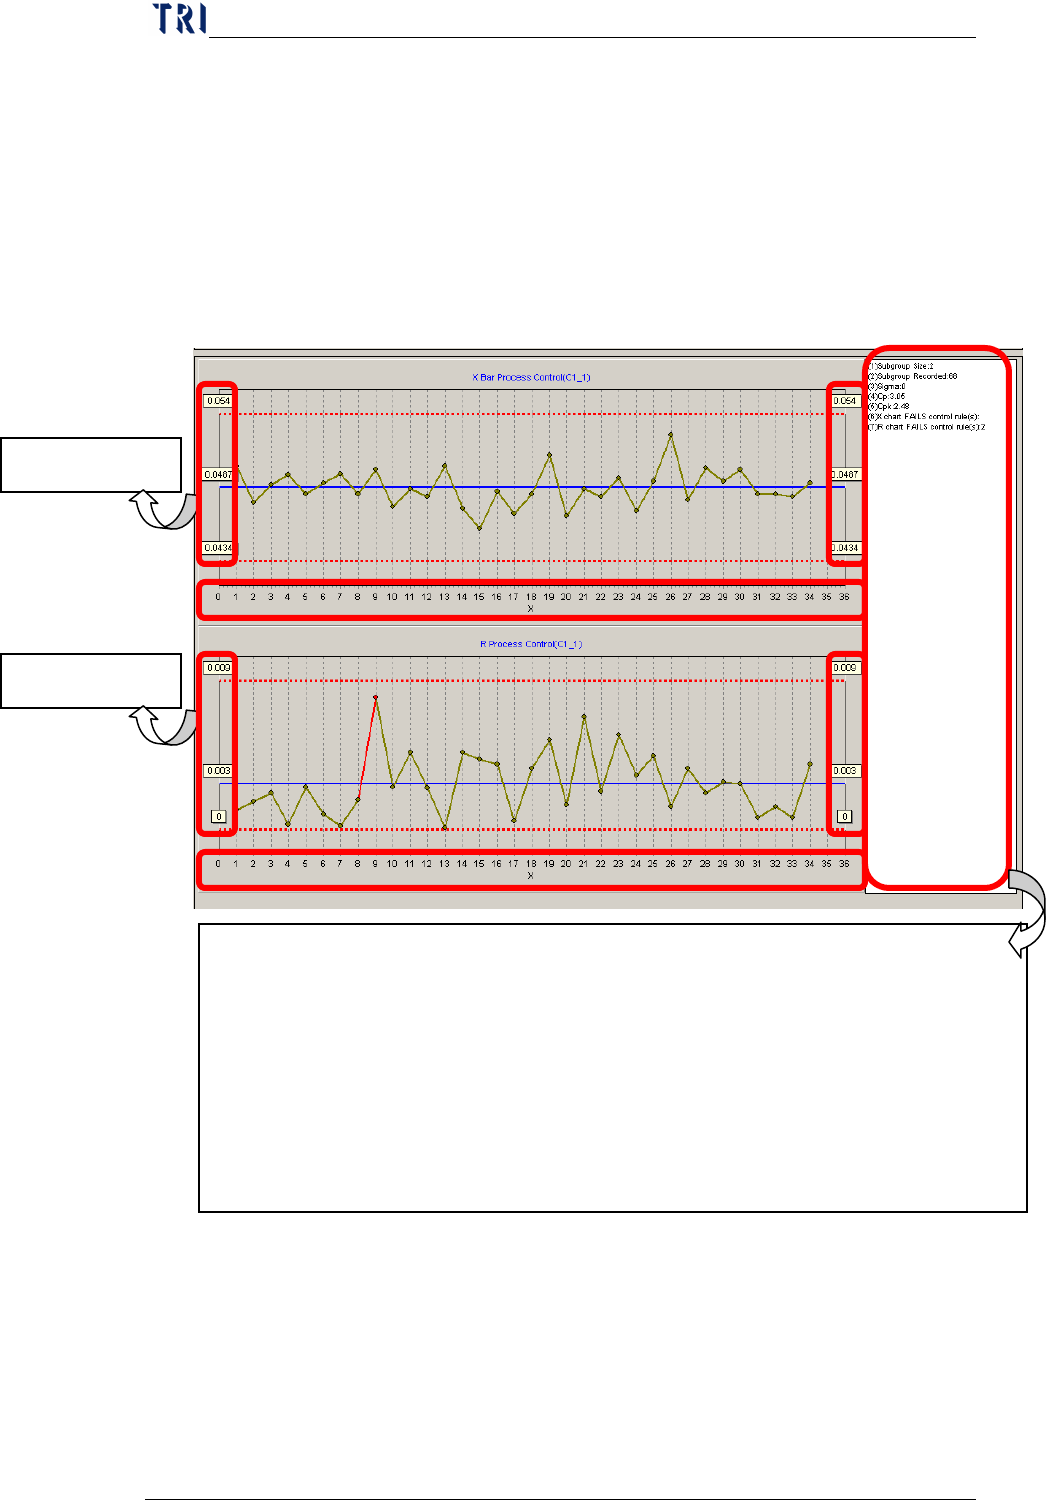
X bar – R Chart: Each monitored component or solder will have
an X bar control chart and an R control chart as show below.
Description of the data
Data at right hand and left hand side: represents the
Upper Control Limit, Control Central Line and Lower
Control Limit.
Data lay below the control chart: displays the serial
X Bar control
R control chart
Description of the data on the right of the control chart:
Subgroup Size: sample size
Subgroup Recorded: number of samples selected.
Sigma: variable
Cp: Cp value
Cpk: Cpk value
X chart FAILS control rule(s): Alarm items violated by the X-bar control
chart up to the present
R chart FAILS control rule(s): Alarm items violated by the R control chart up
to the present
Chapter3 SPC User Manual
AOI Repair Station
114
numbers of sampling. For example, if the number is 8,
it means the 8
th
sampling.
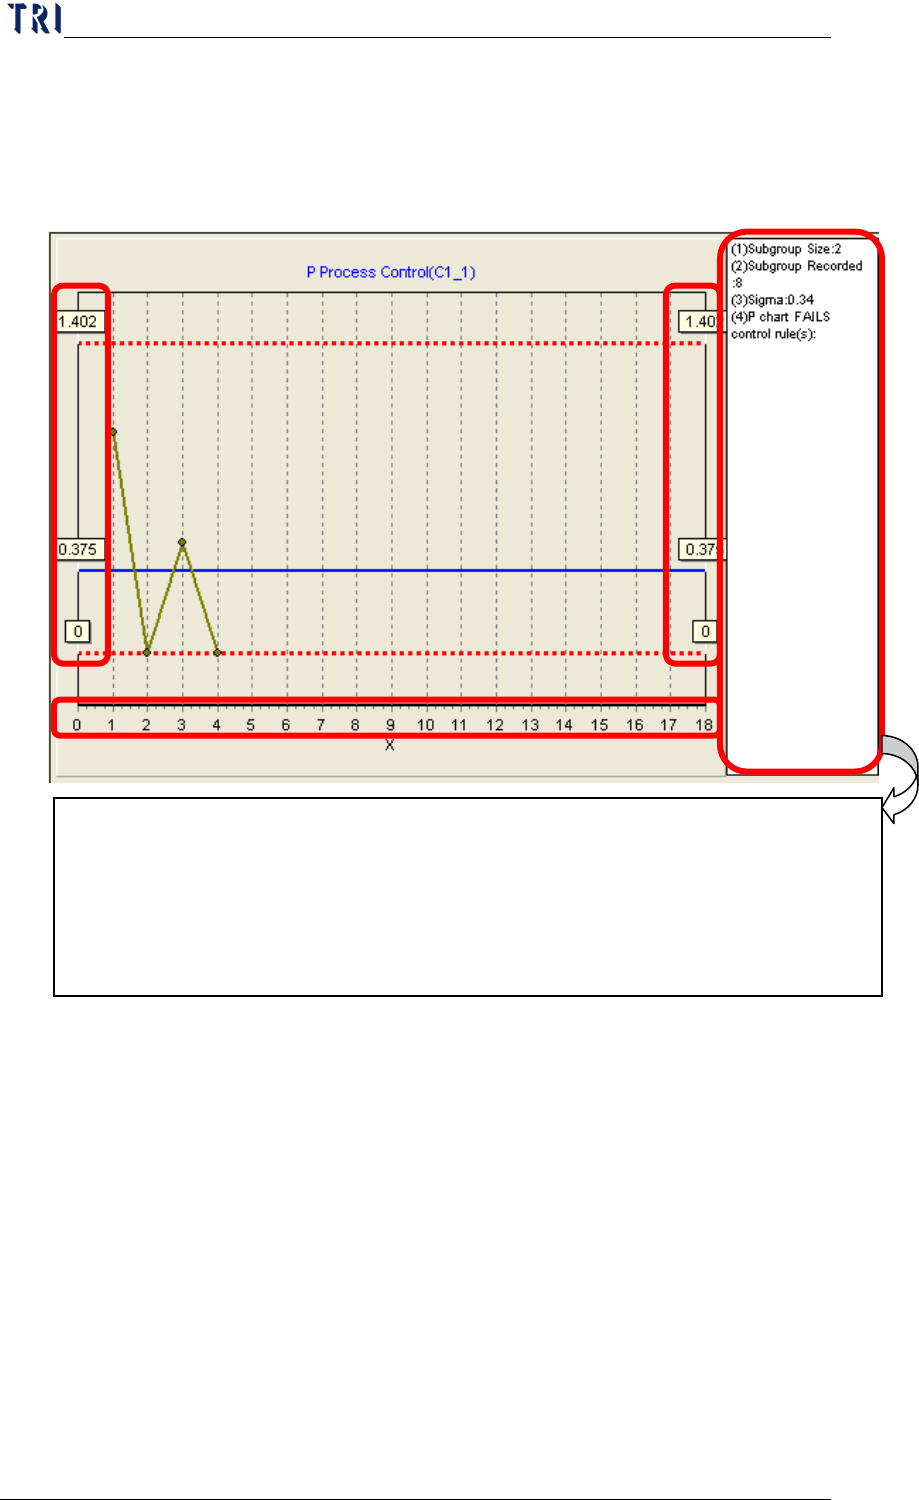
P Chart: Each monitored component or solder will have an R chart
as show below.
Description of the data
Data at right hand and left hand side: represents the
Upper Control Limit, Control Central Line and Lower
Control Limit.
Data lay below the control chart: displays the serial
numbers of sampling. For example, if the number is 8,
it means the 8
th
sampling.
7.4 Explanation - Steps
The entire software can be explained in four parts: [pre-monitoring],
[start monitoring], [monitoring] and [post monitoring]. [Pre-monitoring]
involves the setting of relevant parameters. Once these parameters are
Description of the data on the right of the control chart:
Subgroup Size: sample size
Subgroup Recorded: number of samples selected.
P chart FAILS control rule(s) :
Alarm items violated by the P control chart up to
the present.