AOI_RS_v85_en.pdf - 第121页
Chap ter3 SPC User Ma nual AOI Repair Station 1 17 7.4.1.2 Contr ol Chart Setting This setting tells the system how man y c ontrol points can be displayed on the control chart. From the Main menu, you can click on Sett…
Chapter3 SPC User Manual
AOI Repair Station
116
performed non-stop.
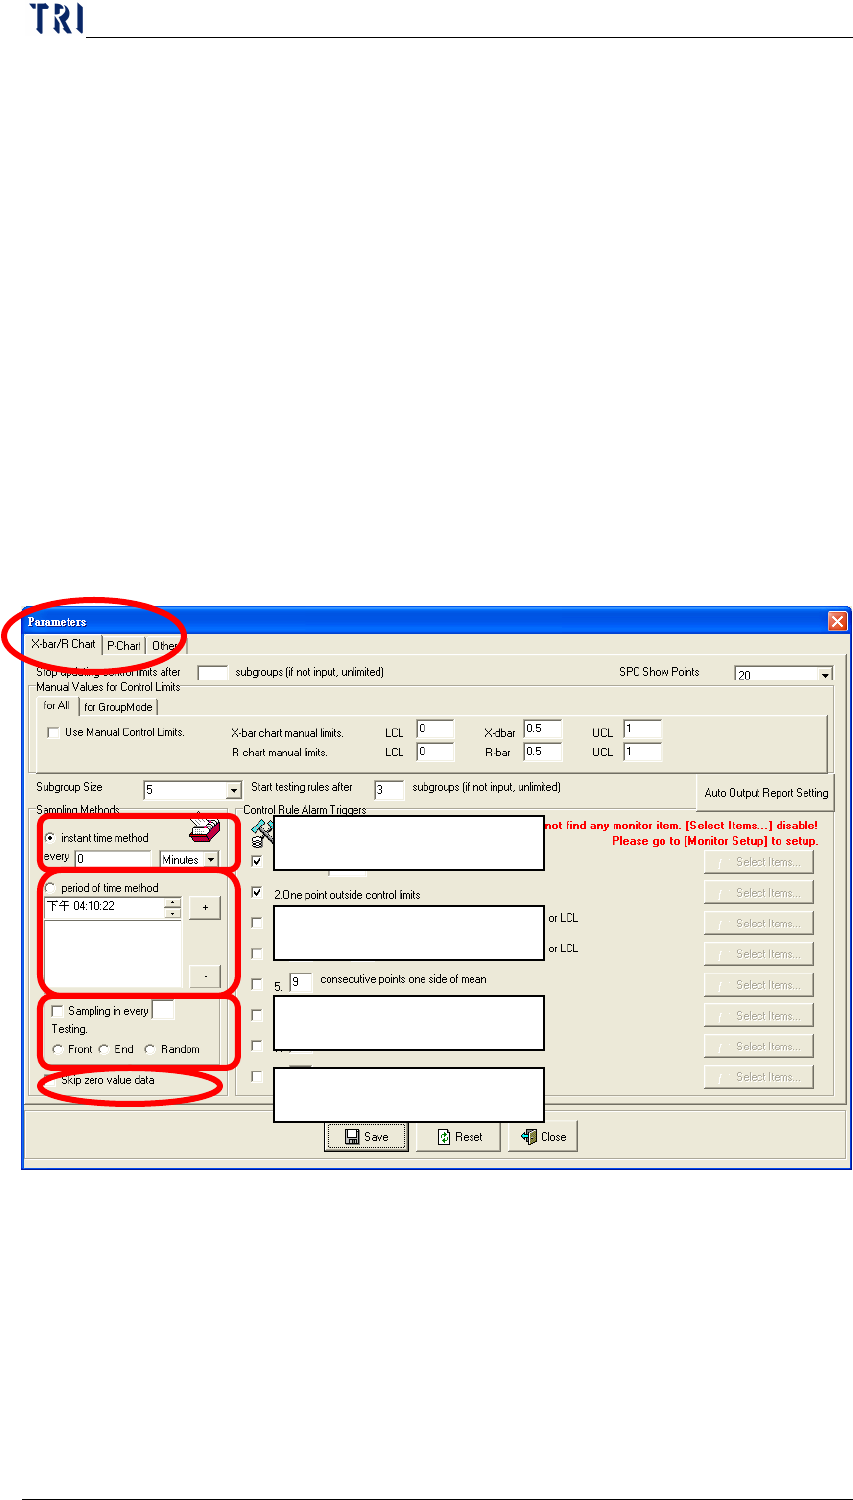
Period of time method: Sets the time zone for
sampling everyday. For example, if you set “Morning
09:00:00”, this indicates that sampling will be
performed once at 9:00 a.m. everyday.
Sampling zone setting: After completing a number of
tests, the system will obtain test data from these tests
from the “Front”, “End” or “Random”. As shown in
the figure below, after completing 10 tests, the system
will obtain 5 test data at random from these 10 tests. (It
is only for “General Mode”, and is not for “Group
Mode.)
Skip zero value data: When the function is selected,
the sampling data with 0 will be skipped.
P Chart: The “P Chart” page contains all parameter settings
for P control chart. As the following picture, user could set
the sampling way at “Sampling Method” area. The meaning
is the same with X-bar and R Chart.
Sampling zone setting
period of time method
instant time method
Skip zero value data
Chapter3 SPC User Manual
AOI Repair Station
117
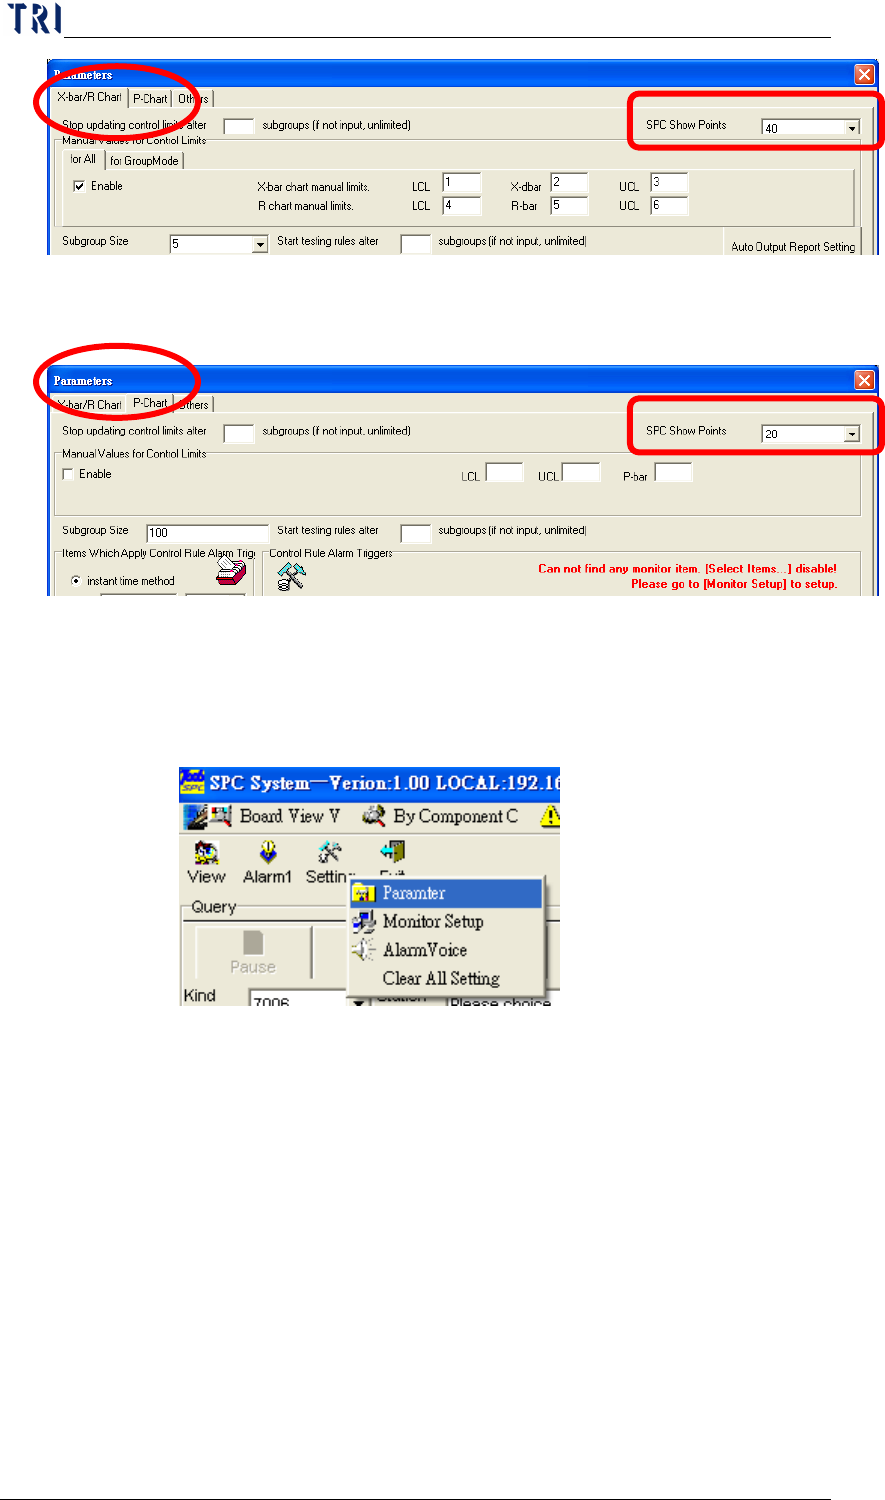
7.4.1.2
Control Chart Setting
This setting tells the system how many control points can be
displayed on the control chart. From the Main menu, you can
click on
Setting and then Parameter as shown in the following
figure.
After entering the setting screen shown below, the “SPC Show
Points” on the upper part of the screen indicates the maximum
number of points that can be displayed on the control chart.
X bar and R Chart: User can change to see page “X-bar/R
Chart” for X bar R Chart parameter setting. “SPC Show
Points” on the top of the page is to set the maximum count
that can be displayed on the control chart.
Chapter3 SPC User Manual
AOI Repair Station
118
P Chart: User can change to see page “P Chart” for P
Control Chart parameter setting. “SPC Show Points” on the
top of the page is to set the maximum count that can be
displayed on the control chart.
7.4.1.3 Manual Control Limits
User could specify the control limits manually then system will not
refresh the control limits. You could press [Setting/Parameter] to
do the setting.
The setting frame is as the following. The same with Sampling
Method, the setting is separated to Xbar-R Chart and P Chart.
X bar-R Chart: Change to [X-bar/R Chart] to do the setting
of X bar-R Chart. [Manual Values for Control Limits] on
the top of the table is to set the control limits for X bar-R
Chart. There are two ways to set the control limits,
explained individually as the followings.
for All: The control limits set here are for all monitoring.
But when the [for GroupMode] control limits enabled,
the control limits set in [for All] field will become
inactive under group mode.
for GroupMode: The control limits set here is suitable
for group mode.