AOI_RS_v85_en.pdf - 第160页
Chap ter3 SPC User Ma nual AOI Repair Station 156 9 X-Y devi ation dispersion diagram The function is to display X shift and Y shift of th e components on AOI machine. The shift graph is dis played after a user determi…
Chapter3 SPC User Manual
AOI Repair Station
155
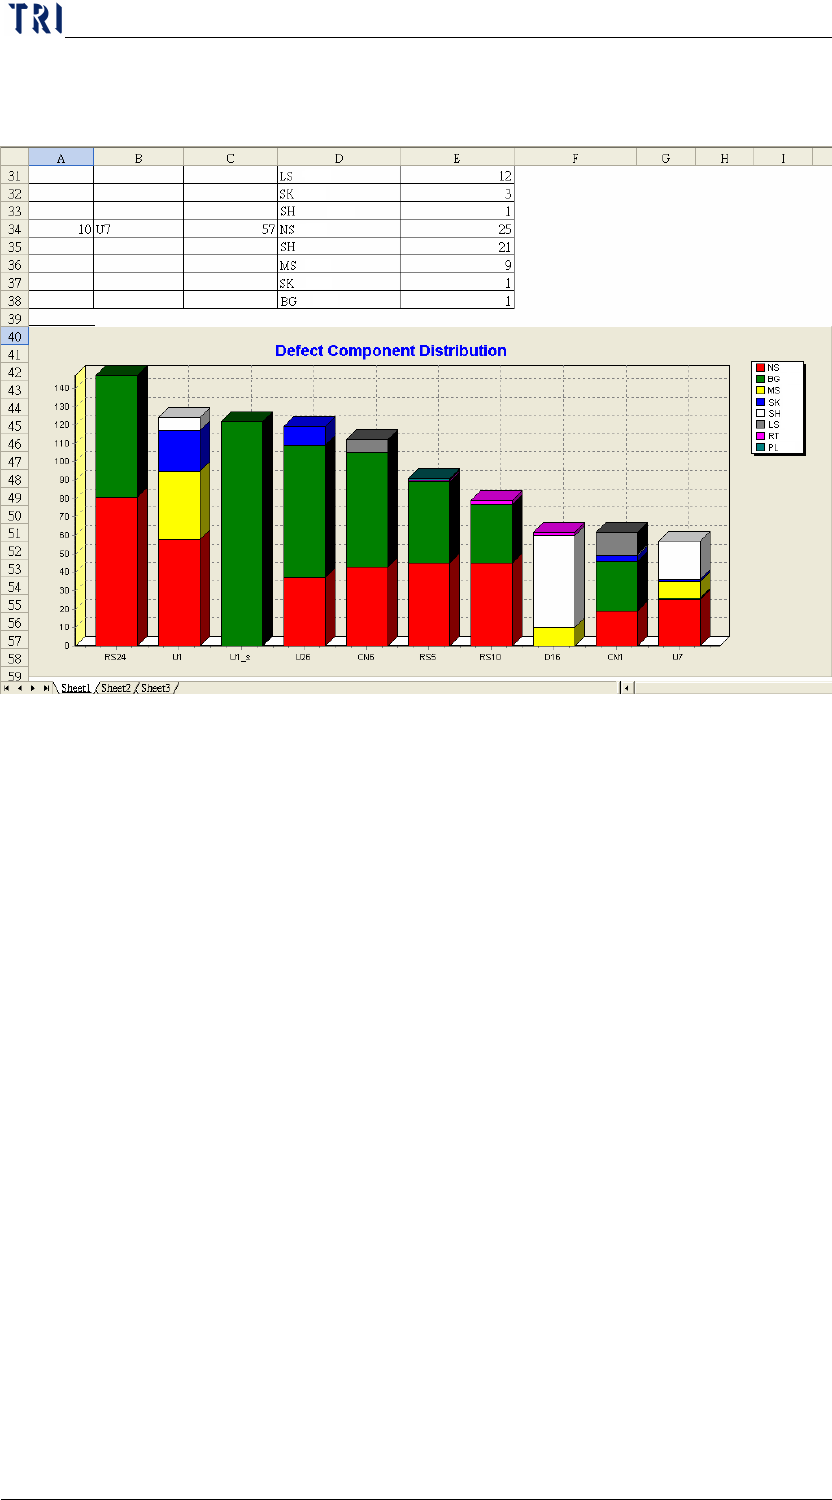
Step2. Pressing [EXCEL] is to create the report automatically in
[C:\rsinstall\DILOG].
Chapter3 SPC User Manual
AOI Repair Station
156
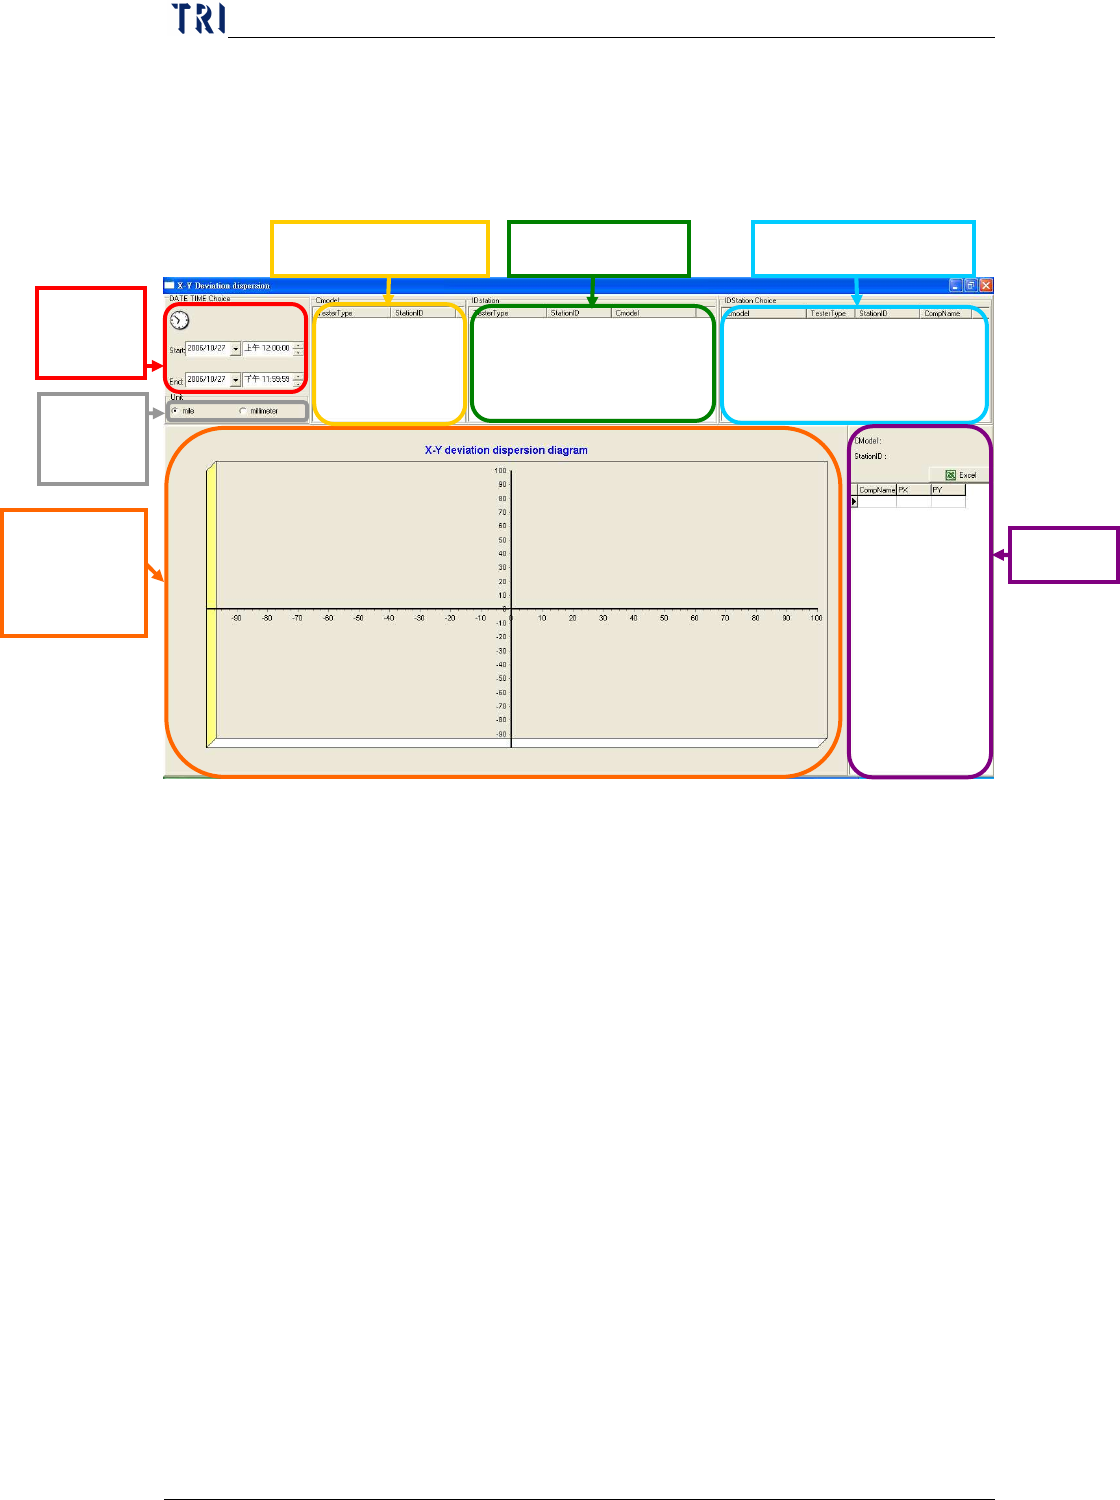
9 X-Y deviation dispersion diagram
The function is to display X shift and Y shift of the components on AOI
machine. The shift graph is displayed after a user determines the time and
machine ID.
Step1.
The user has to select a period of time and the unit, then all the
existing machine IDs will be displayed. After user selects a
machine he wants to review, system will display all the models
(CModel) in this machine. Then user just has to select a CModel to
review the components tested in this model.
Select
date.
Scatter
Plot of PX
and PY
PX、PY
Select Component Select Machine ID
Select CModel
Select
unit
Chapter3 SPC User Manual
AOI Repair Station
157
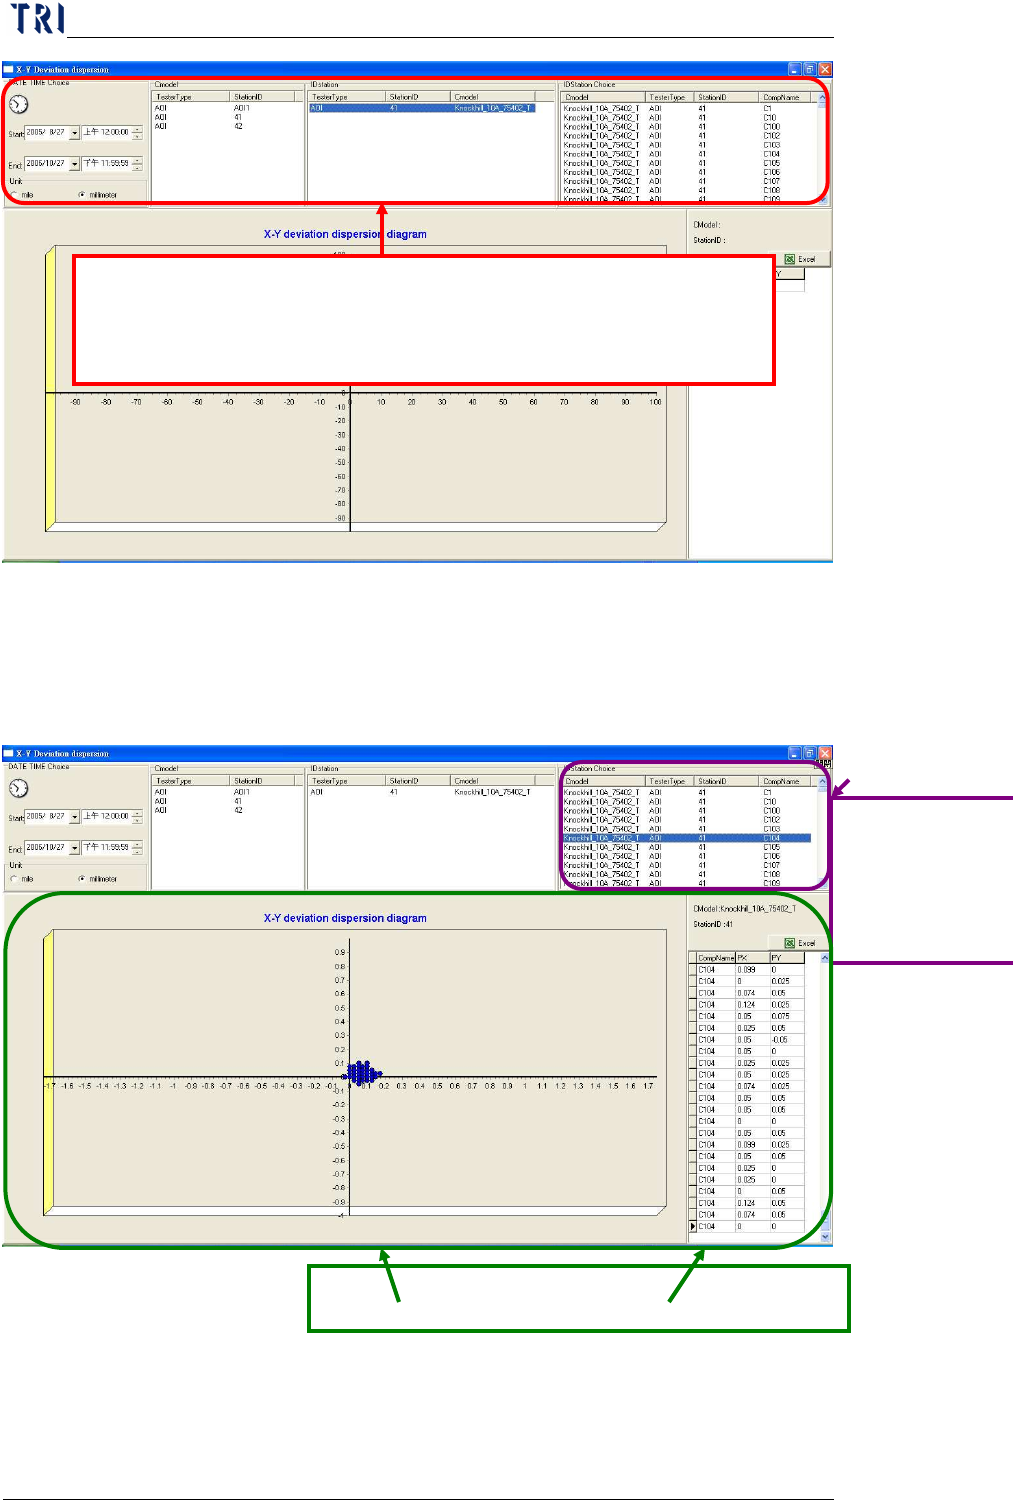
Step2.
Select the component name and program will automatic draw all the
points along with the information chart at right. User may click the
[EXCEL] in order to generate the EXCEL sheet. This sheet will be
saved under program file under the name of [PXPY]
10
Component Shift X, Y
The function is used for checking all the statistic related information which
System will automatic show the selected component name which is
according to period of time, unit, machine ID, and CModel picked by
user
點選欲查看的元
件
Select a
component name
Show all the points spread and information charts.