AOI_RS_v85_en.pdf - 第163页
Chap ter3 SPC User Ma nual AOI Repair Station 159 CP=(USL-LSL)/6 σ σ : Standard De viation---------- √((nΣx²-(Σx) ²)/(n(n-1))) USL= Upper Specification L imit LSL=Lower Specification L imit Zusl=(Usl-Mean)/3σ ZLsl=( Me…
Chapter3 SPC User Manual
AOI Repair Station
158
is included the standards, placer, inspection, and Cpk etc. Please see the
following pictures as reference.
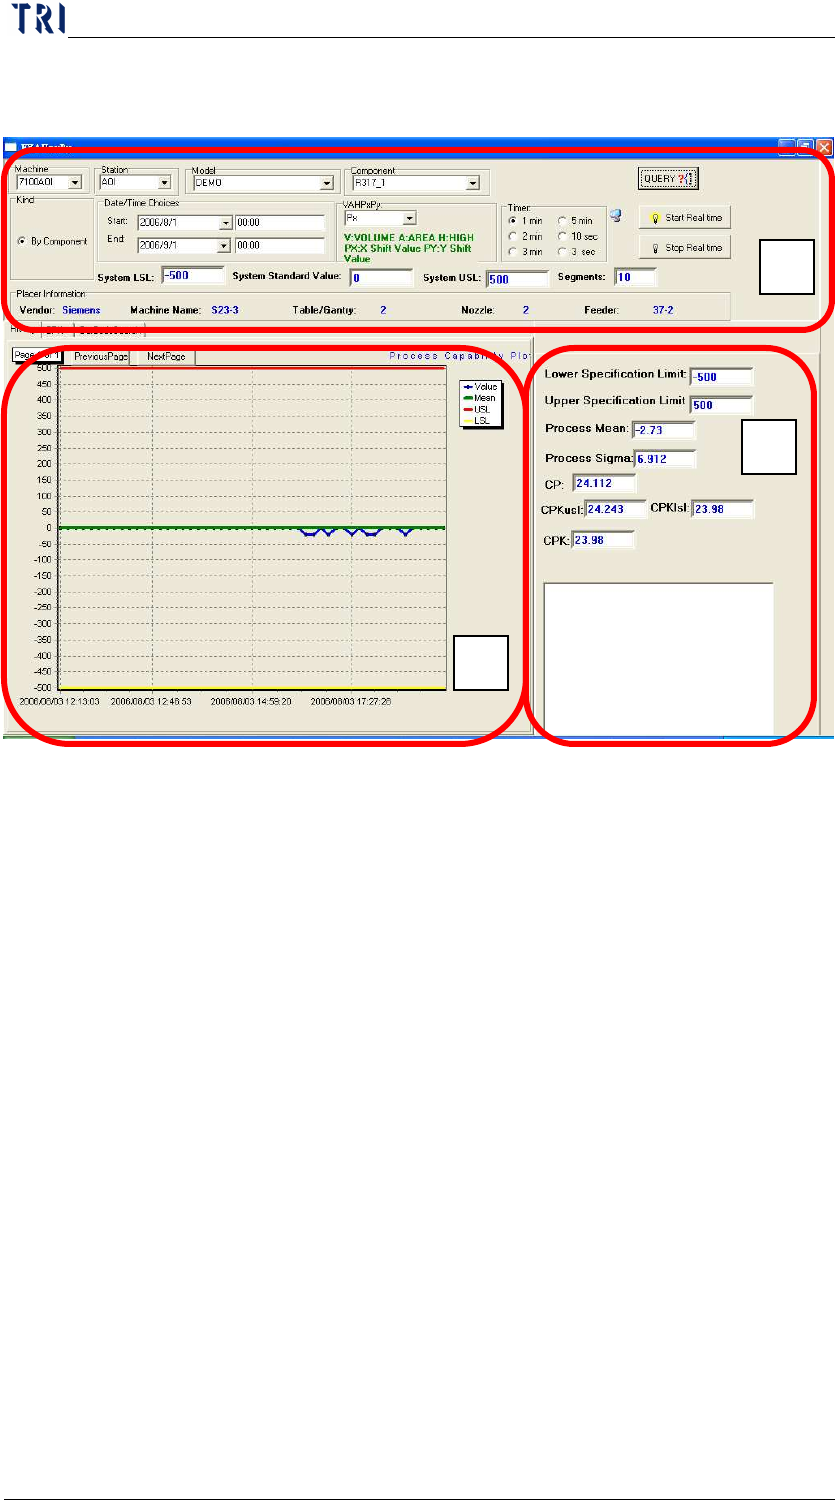
10.1
A Section
System LSL, System Standard Value, and System USL are the
component specification and upper-lower limitation data. User may
modify each variable accordingly. Press [Query] once the change are
made.
Placer information: This area will show the Placer information for
each component.
User may view real-time inspection by select [Start Realtime] under
the time, and stop with [Stop Realtime]
10.2 B Section (History)
Red line mean upper standard level (USL), Green line mean (Standard
Value), yellow line means lower standard level, and blue line means
test result.
The latest 25 data are showed in the diagram. User may use
[nextpage]
、[periouspage] to view more data before the first 25.
10.3
C Section
C section is showing all the related data that system will need to
calculate the Cpk as following items.
A
B
C
Chapter3 SPC User Manual
AOI Repair Station
159
CP=(USL-LSL)/6σ
σ : Standard Deviation---------- √((nΣx²-(Σx) ²)/(n(n-1)))
USL= Upper Specification Limit
LSL=Lower Specification Limit
Zusl=(Usl-Mean)/3σ
ZLsl=( Mean-LSL)/3σ
USL= Upper Specification Limit
LSL=Lower Specification Limit
Mean=Measured Process Average
Zusl=Capability to meet USL
ZLsl=Capability to meet LSL
σ : Standard Deviation-----------
√((nΣx²-(Σx) ²)/(n(n-1)))
CPK=lesser of Z usl AND Z lsl
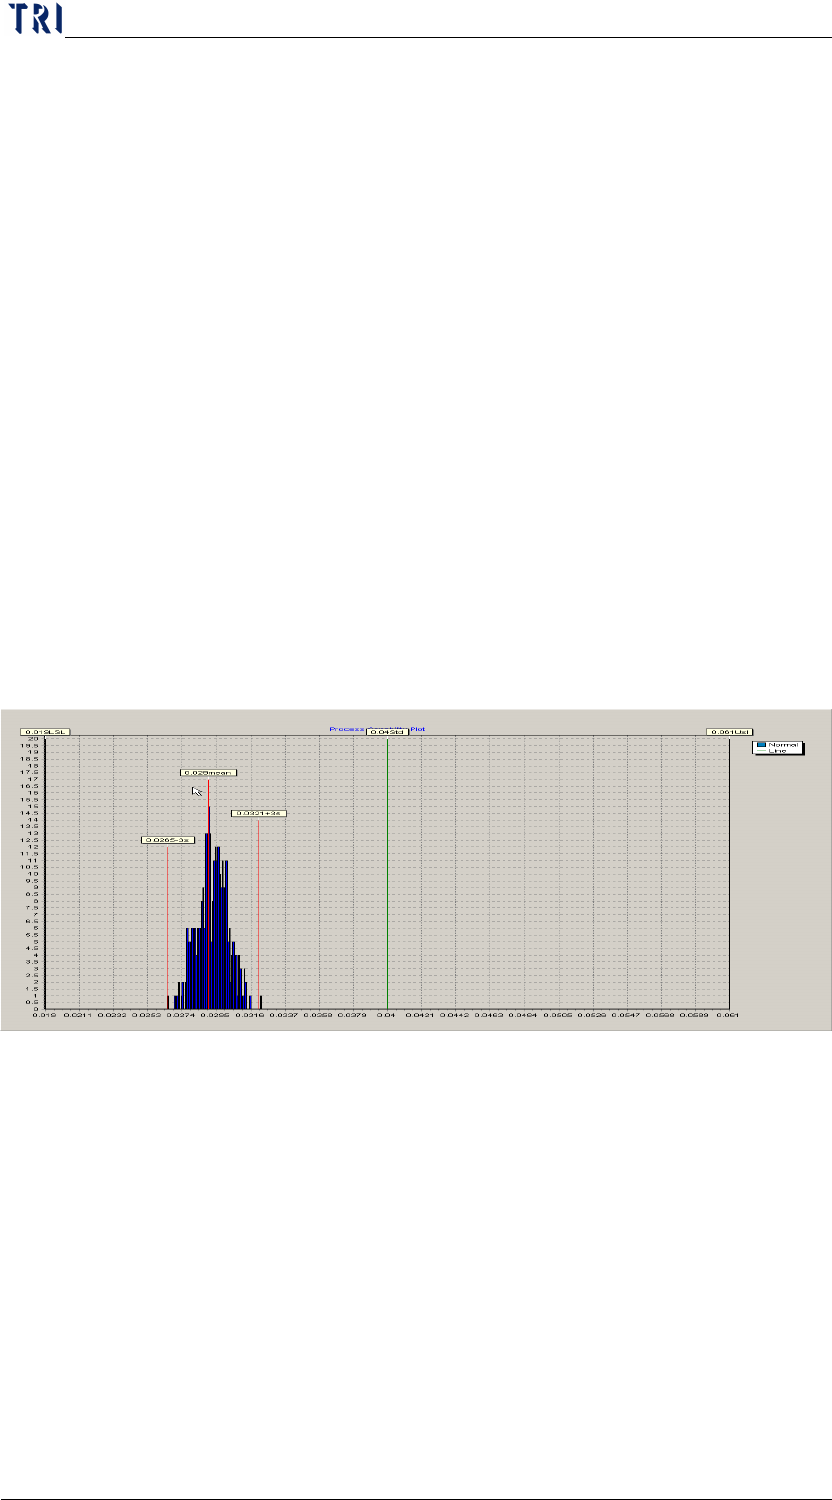
10.4 Cpk section
Under Cpk Diagram, user may check the calculated Cpk value in chart.
Green lines are the USL and LSL value of the component, and red lines are
the center control value, USL, and RSL for the 3 sigma
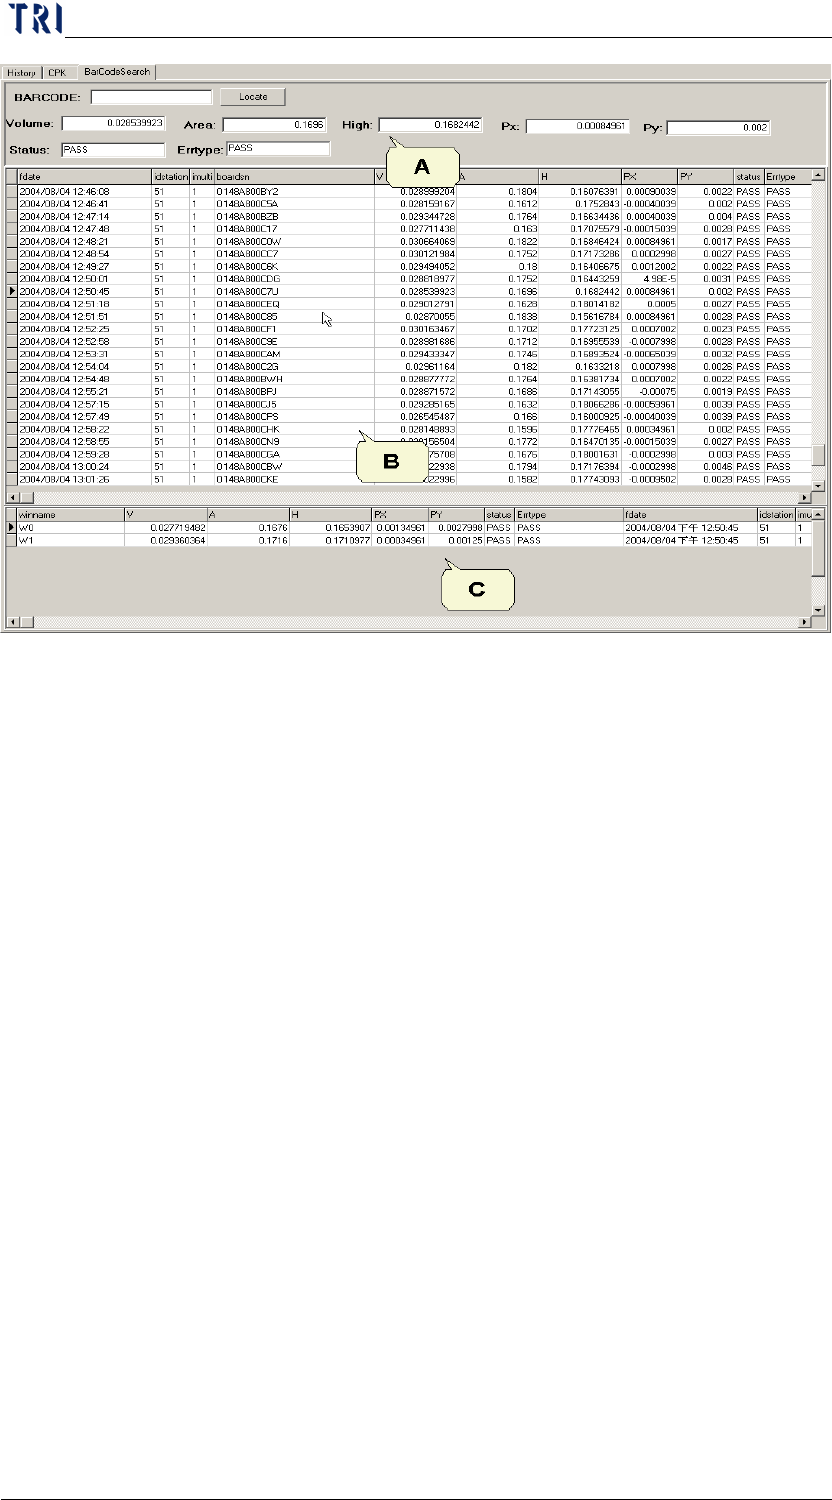
10.5 Barcode Search Section
Under BarcodeSearch. User may search related barcode data in real-time
Chapter3 SPC User Manual
AOI Repair Station
160
A: the current data information
B: All the data information in real-time
C: the detail information of data in real-time.
11 Top Defect by Placer
User may check this function to find out the top defect points which may
cause by the placer. The system will compare and analyst defect points
with Placer’s angle data in order to locate the Nozzle or Feeder problem
locations. Please see more details in the following pictures.