3OM-1343-008_w.pdf - 第208页
5-23 AKFEDT -ID 0607-003 3. Pattern Program Management Data The corresponding "Pattern Program Management Data" window enables the operator to view the pattern program management data of the selected model for …

5-22
AKFEDT-ID
(2) Component chuck
[((*total comp.-(*A+*B+*C+*G))/*Total comp.)
×
100] (%)
The value (%) is determined by the following formula.
# of Picks - (Counts in "A" + Counts in "B" + Counts in "C"+ Counts in "G")
×
100
# of Picks
(3) Component placement
[((*total comp.-(*A+*B+*C+*D+*E+*F+*G))/*Total comp.)
×
100] (%)
The value (%) is determined by the following formula.
# of Picks - (Counts in "A" + Counts in "B" + Counts in "C"
+ Counts in "D"+ Counts in "E"+ Counts in "F"+ Counts in "G")
×
100
# of Picks
Note
About Data Counting (Counting of "*A: component missing [sensor]"
and "*B: component missing [recognition]")
The machine stops in an error condition according to the number of times
(the number of continuous component missing errors to be counted to stop
the machine in an error condition) set in the "1" text box of "Error process"
in the "Control Data" tab sheet of a "Component Library" window. In this
case, the number of missing component errors is not added to the number
of picks and the number of chuck errors.
0607-003
2.4 Handling/Placement Data
5-23
AKFEDT-ID
0607-003
3. Pattern Program Management Data
The corresponding "Pattern Program Management Data" window enables the
operator to view the pattern program management data of the selected model
for each individual pattern programs.
When the [Open] button is pressed after the desired model is selected in
the "Patt Prgm Mng Dt" window, the "Pattern Program Management Data"
window appears.
[2]
[1]
[3]
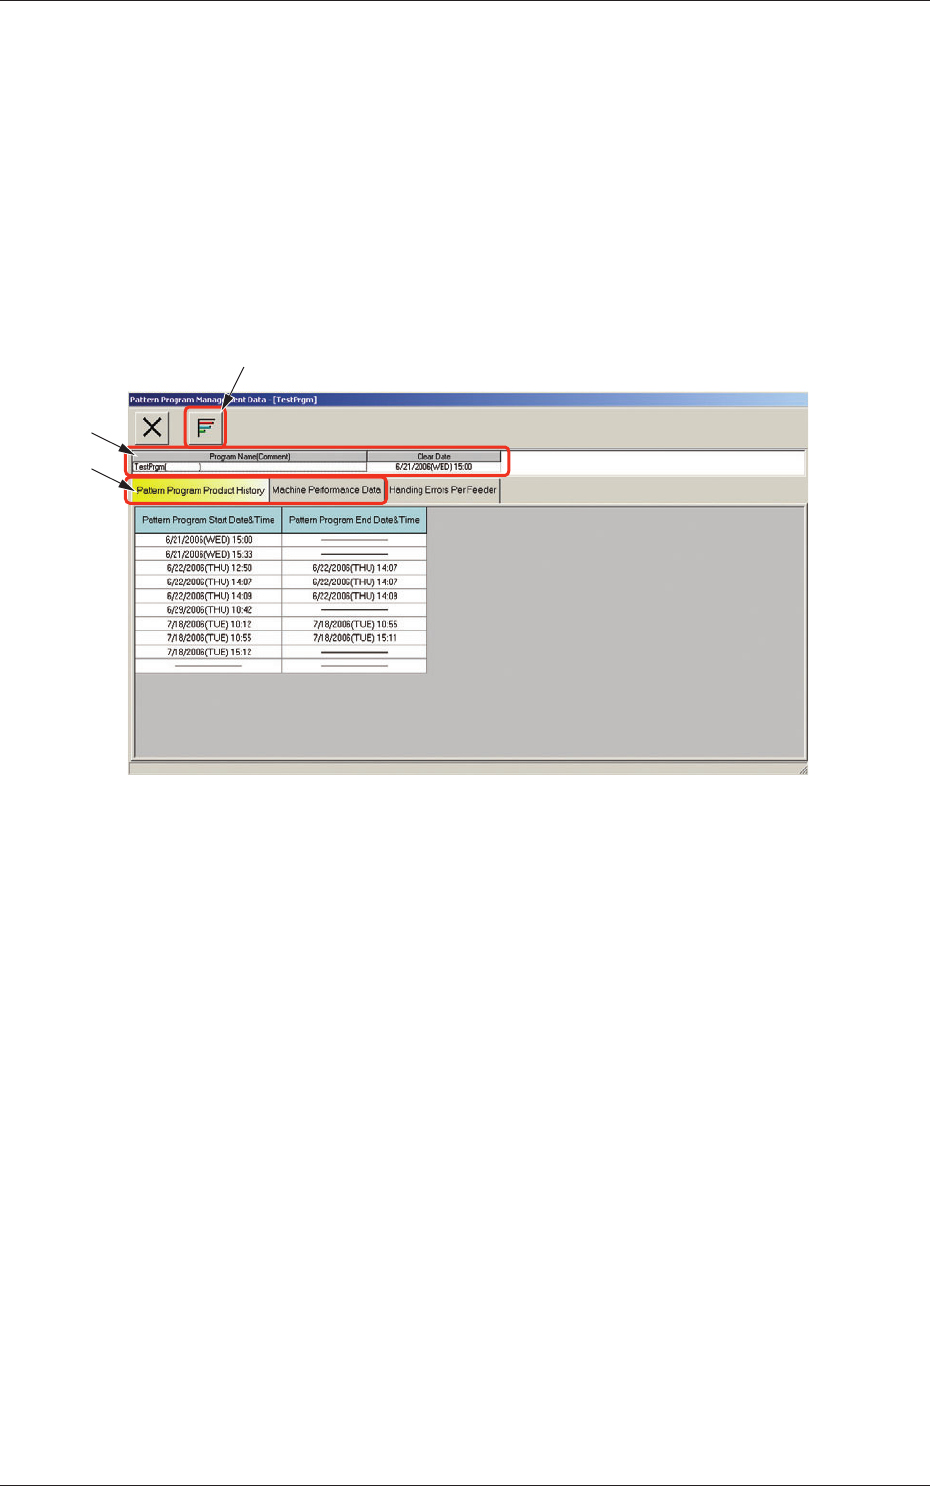
Fig. 3E12 "Pattern Program Management Data" Window
[1] [Graph Display] Button
When selected, this button graphically displays the status of each item.
[2] Program Name
Displayed are the pattern program name (comment) and the clear date.
3. Pattern Program Management Data
5-24
AKFEDT-ID
[3] Tabs and Tab Sheets
The "Pattern Program Management Data" window is provided with the
following three tabs. When each tab is pressed, the corresponding tab
sheet appears inside the window.
Table 3E4
Tabs Description
Pattern Program Product
History
The corresponding tab sheet enables the operator to check the date
and time logs that show when the use of the selected pattern
program was started or ended.
Machine Performance Data
The corresponding tab sheet enables the operator to view the listed
data such as "PCB counter", "Product PCB", "Passed PCB", "Product
PCB (BBR) (option)", "Total components", "Total handling errors",
"Rate of handling errors (%)", "Shortage of component", "PCB
process time", "Power on time", "Maintenance time", "Test mode
time", "Total handling errors/Total components", etc.
Handling Errors Per Feede
r Displayed is a list of "Total Components", "Number of Errors
(classifi ed by error types)", "Total Errors", "Rate of Error (%)",
"Shrtg. of Comp.", "Component ID.", "Type", and "Width (mm)" for
each feeder No. (actual feeder No.).
[4] [5]
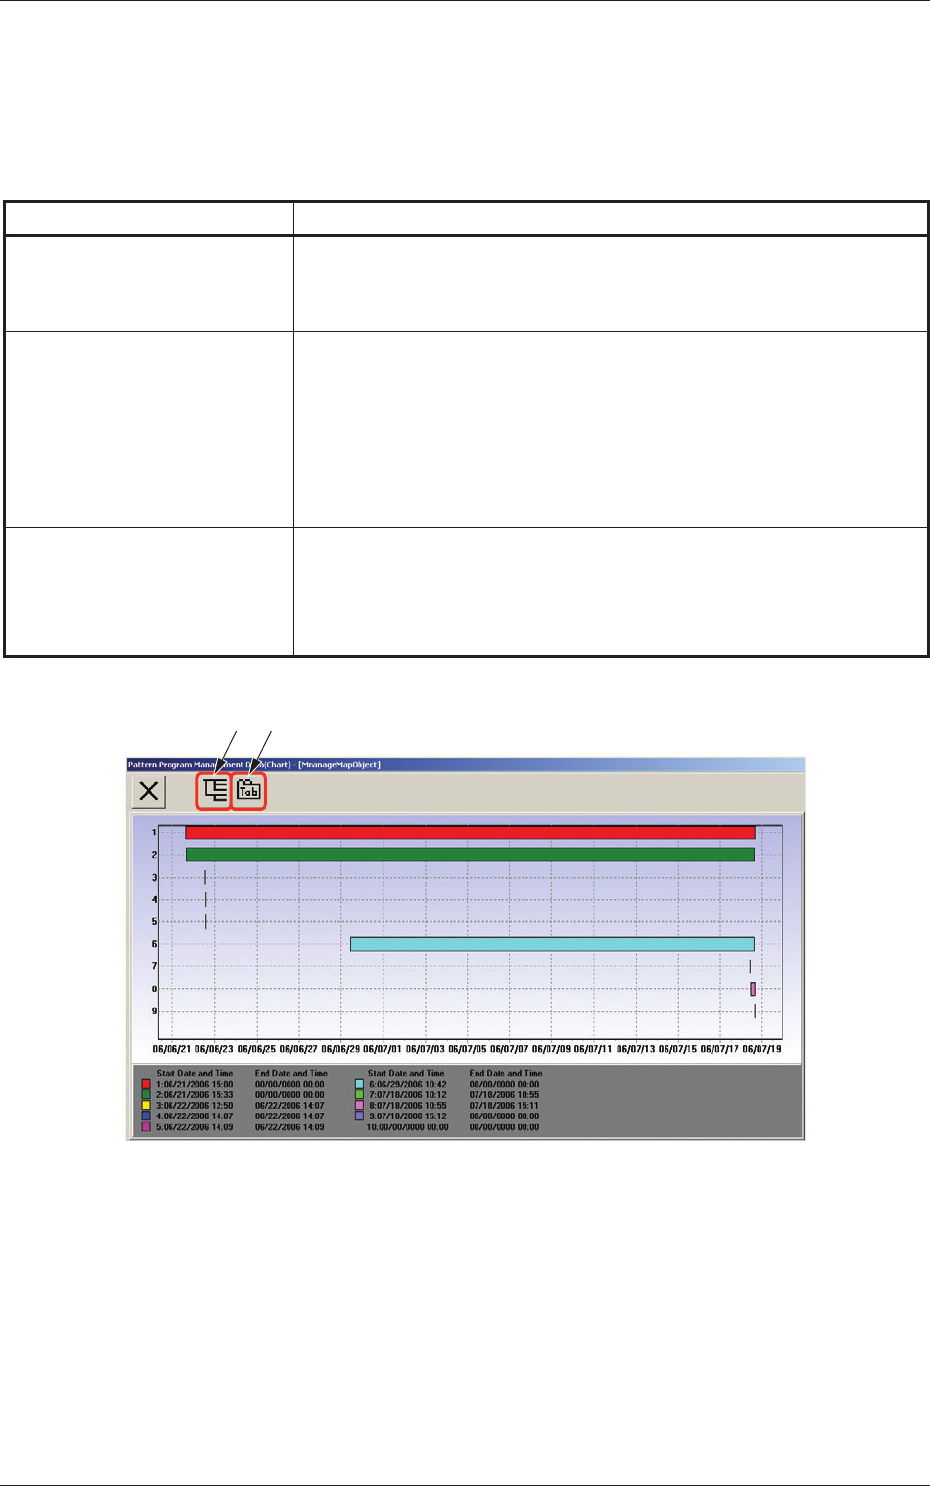
Fig. 3E12-1 "Pattern Program Management Data (Chart)" Window
[4] [Tree Display] Button
When selected, this button displays the tree (hierarchical) arrangement
of data names, enabling you to select the desired data.
[5] [Tab Display] Button
When selected, this button displays submenu sheets with extensions
called "tab", enabling you to select the desired tab sheet.
3. Pattern Program Management Data
0607-003