YSM10安装调整(eng).pdf - 第73页
For Service Engineer Service Information SI1610004E - 000 = YSM10_Procedures for the adjustments required a fter installing a machine 73 / 107 6.9.2 Export the “ Result.dat ” accuracy data after the adj ustment If the st…
For Service Engineer
Service Information
SI1610004E-000= YSM10_Procedures for the adjustments required after installing a machine
72/107
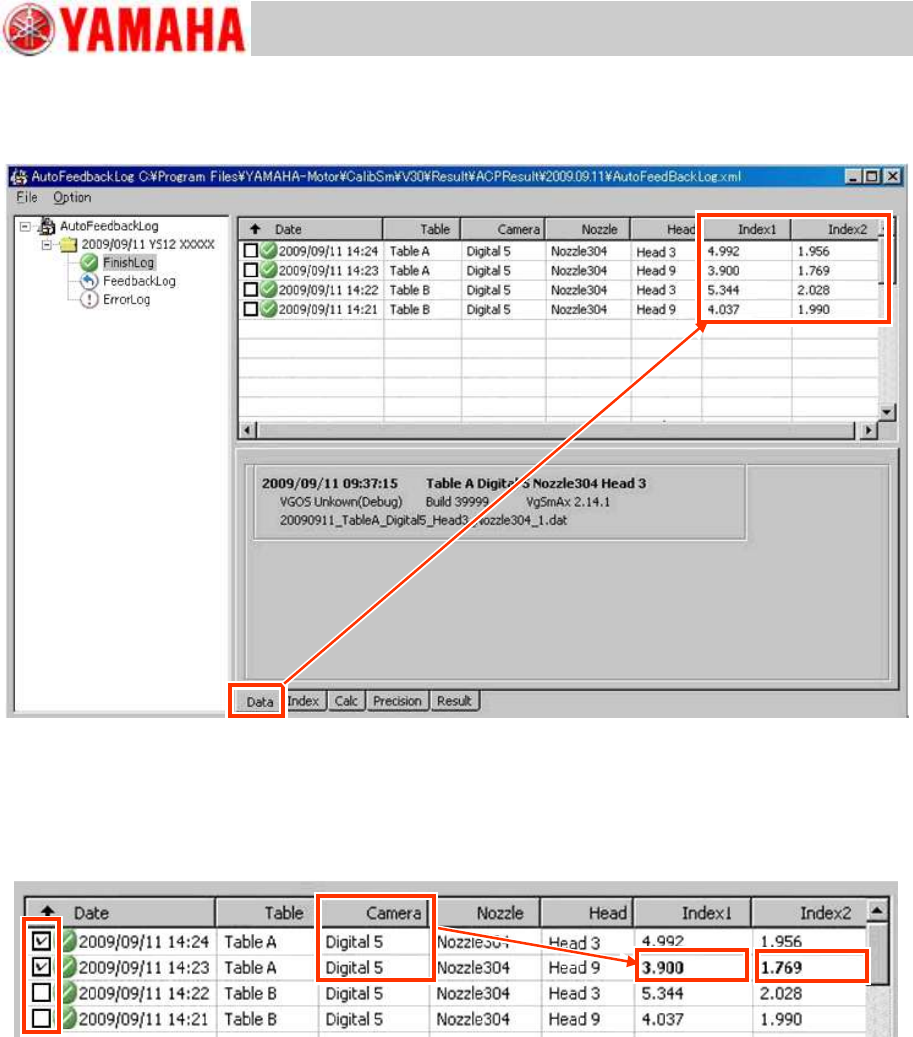
3. Display the “Data” tab on the “FinishLog” window.
Index 1, 2 of the final data that have been adjusted separately can be checked on the window.
Figure 100
4. Check the total Index.
If you tick the checkboxes on the left of the chart, the worst value of the Index 1 and 2 are indicated
by the boldface.
The figure below shows the total Index of Digital 5.
Figure 101
5. Fill in the Total Index (Index1, Index 2) on the check sheet.
For Service Engineer
Service Information
SI1610004E-000= YSM10_Procedures for the adjustments required after installing a machine
73/107
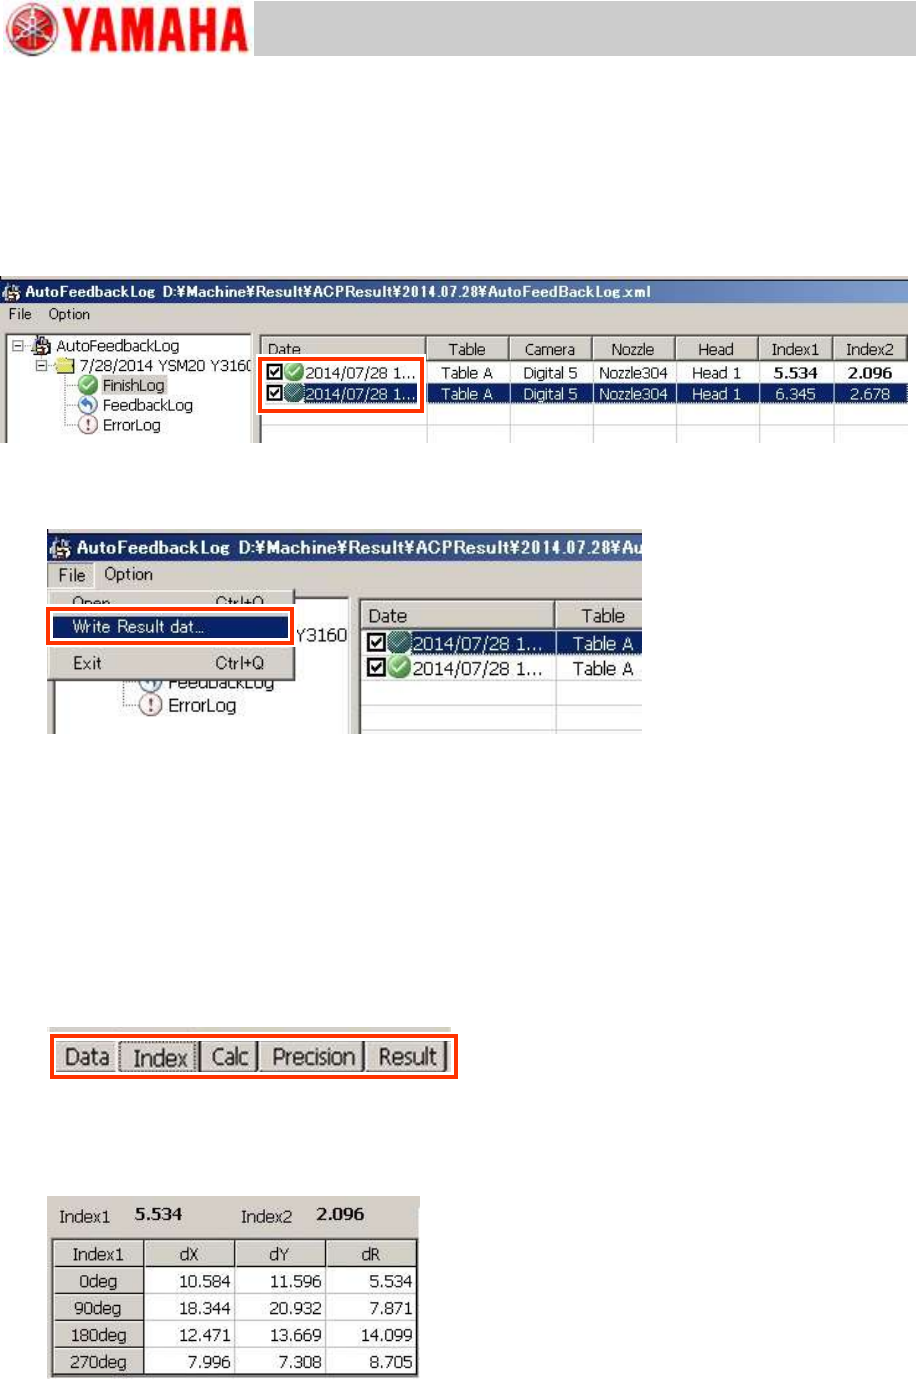
6.9.2 Export the “Result.dat” accuracy data after the adjustment
If the status of the accuracy data after the adjustment needs to be graphed out on the VgChart,
export the “Result.dat” file and create VgChart by using the “VgChart Utility” on other PC.
1. Select the file to be exported.
Tick the checkboxes of the files to be exported on the “Date” column.
Figure 102
2. Select ”Write Result data” from the “File” pull-down menu.
Figure 103
3. Specify the destination and save the data.
The data is written to the specified destination as the “Result.dat” file.
* The accuracy data before the adjustment can be exported on “FeedbackLog”.
See “6.9.5 Export the accuracy data “Result.dat” before the adjustment” for the method.
6.9.3 Other tabs
The adjustment result can be checked on the “Data” tab, and the detailed result can be checked
on the following tabs.
Figure 104
“Index” tab
The detailed information of the Index for each adjustment result can be checked.
Figure 105
For Service Engineer
Service Information
SI1610004E-000= YSM10_Procedures for the adjustments required after installing a machine
74/107
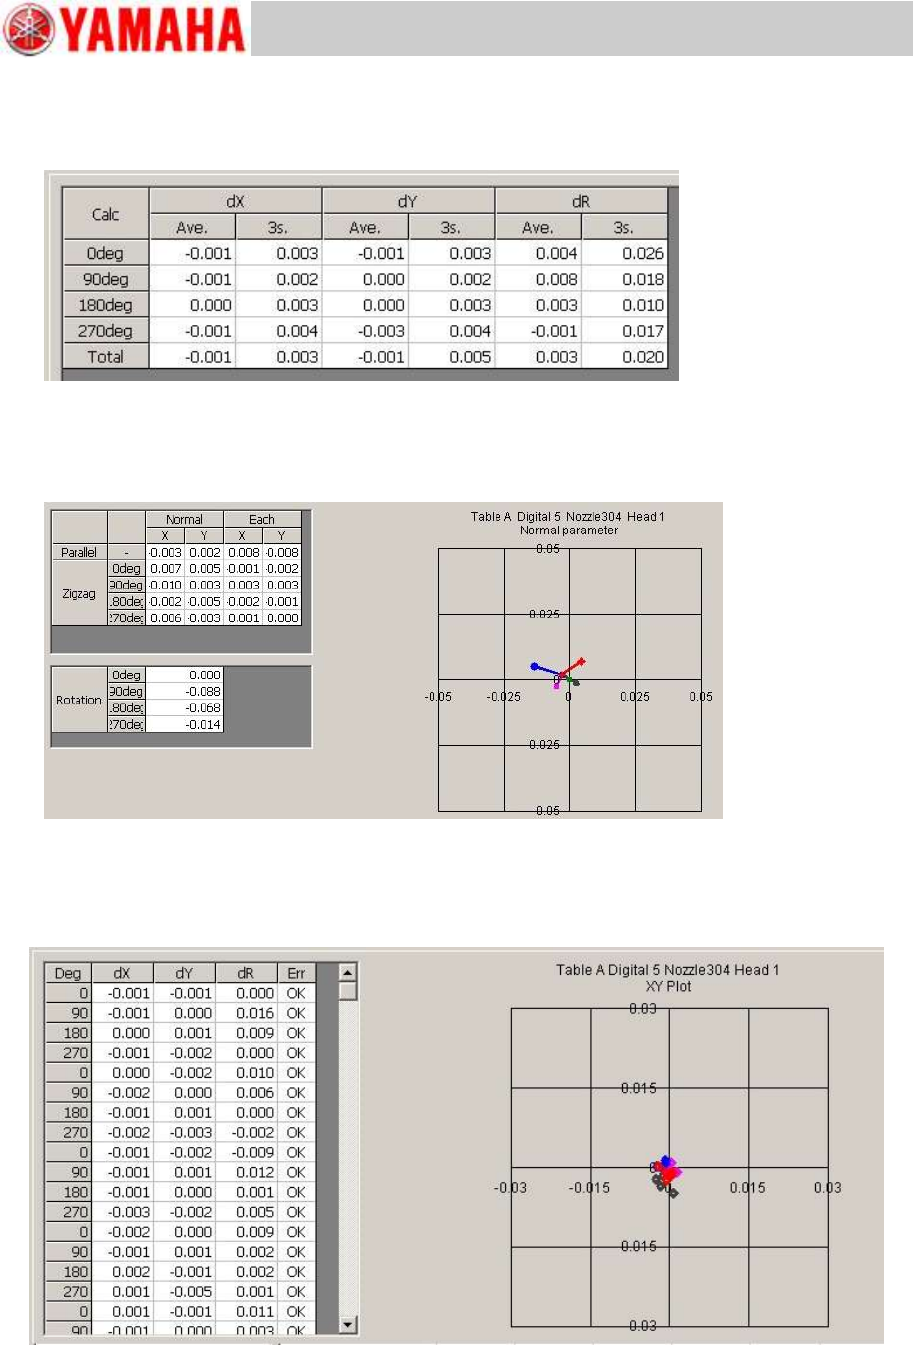
“Calc” tab
The detailed information of the mounting result for each adjustment can be checked.
Figure 106
“Precision”
The parameter calibration information for each adjustment result can be checked.
Figure 107
“Result” tab
The mounting result after the adjustment for each result can be checked on the graph.
Figure 108