00190802-02.pdf - 第329页
User’s Manual Line Computer UNIX 11 Production Tools / Optimization Software Version 402.xx Edition 06/96 11.4 Optimizati on Dialog 11 - 33 Displaying optimization results for individual jobs: ● Clic k on . ● Click on th…
11 Production Tools / Optimization User’s Manual Line Computer UNIX
11.4 Optimization Dialog Software Version 402.xx Edition 06/96
11 - 32
-
Display Results
This icon enables the results of the set-up optimization process to be displayed graphically both for the
entire lot file or for the individual jobs of a lot file. Moreover, the results of the producibility check can be
displayed for the individual jobs.
Displaying the optimization results for the entire lot file:
●
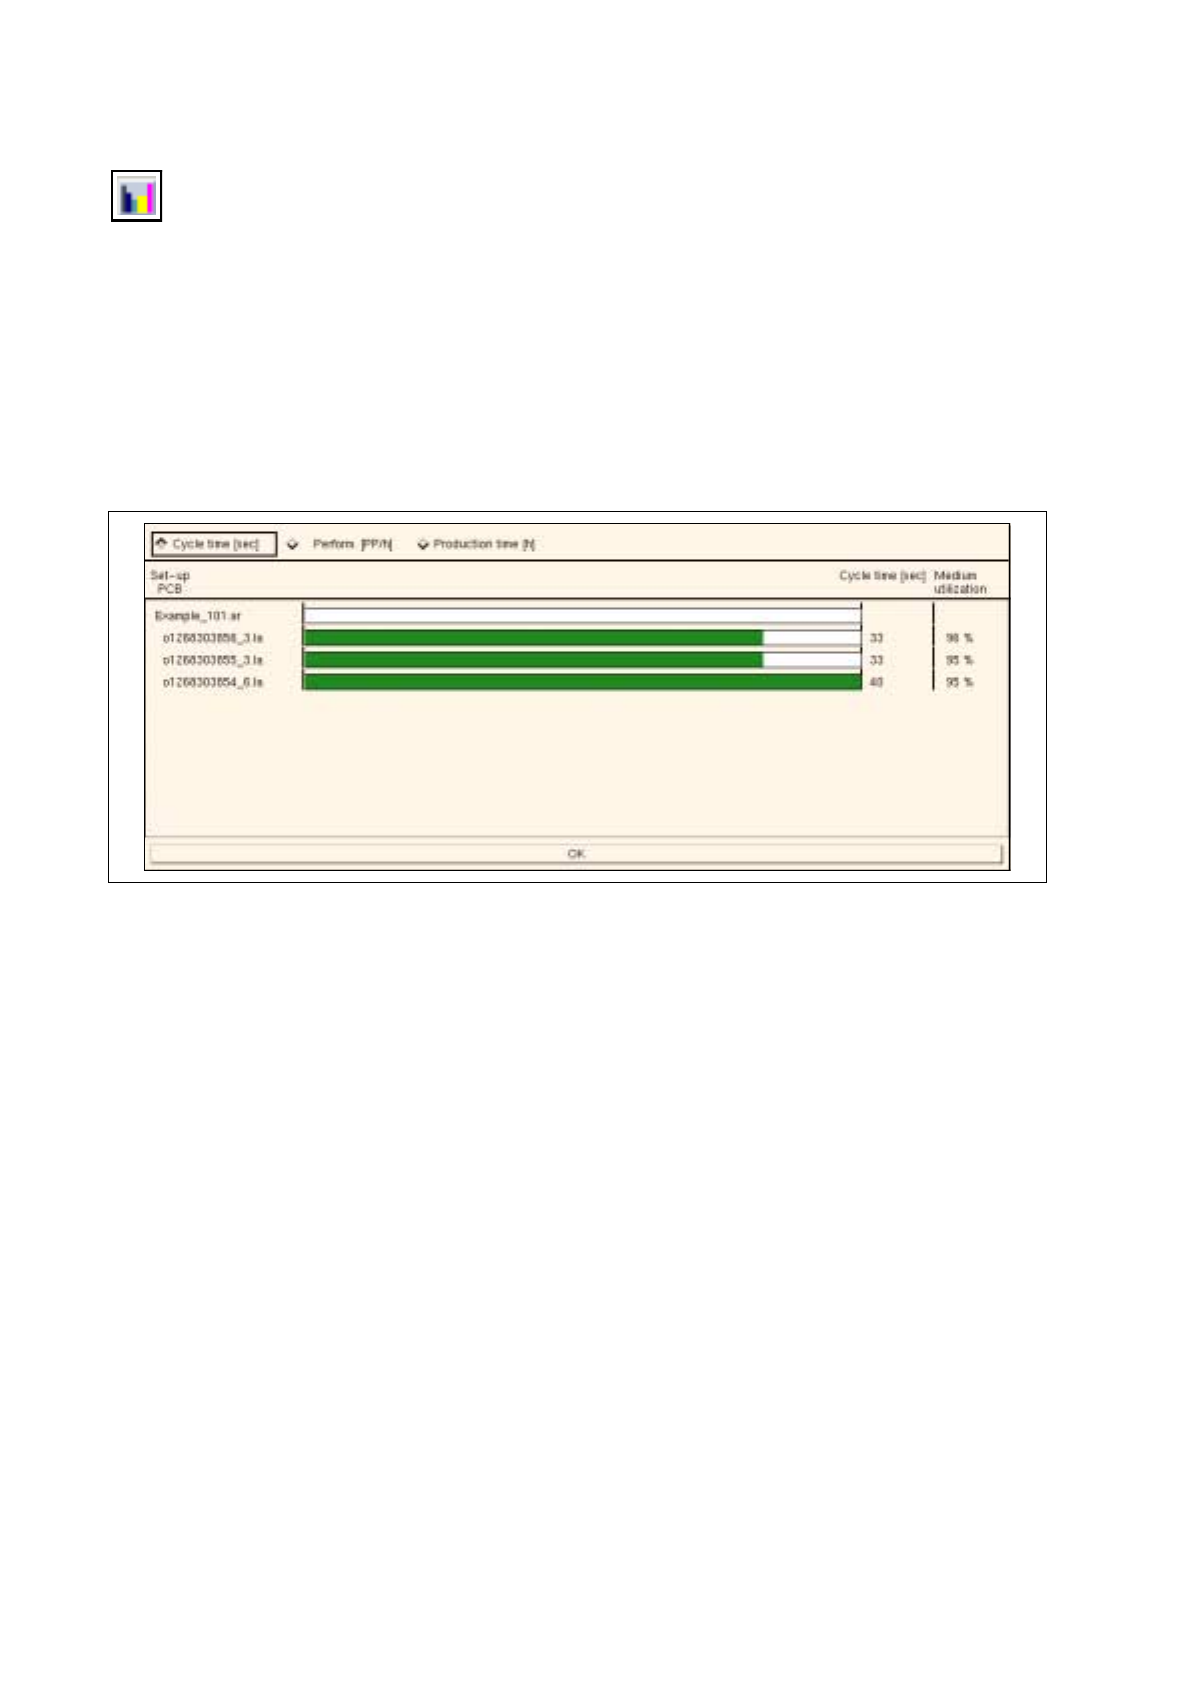
The results of optimization are displayed in the „Optimization results for xx.lose“ window
(see Fig. 11.4.3).
Fig. 11.4.3 „Optimization results for xx.lose“ window for a lot file
In the „Optimization results for xx.lose“ window, the following results can be called up:
-
Cycle time [sec]:
activation of this button causes the cycle time expected by Optimization, i.e. the
placement time (in seconds), to be displayed for all PCBs of the lot file.
-
Perform. [PP/h]:
activation of this button causes the performance of the line (in components per hour)
expected by Optimization to be displayed for all PCBs of the lot file.
-
Production time [h]:
activation of this button causes the production time (in hours) expected by Opti-
mization to be displayed for all PCBs of the lot file. The yellow bars represent the length of time re-
quired for the changeover to a different setup.
User’s Manual Line Computer UNIX 11 Production Tools / Optimization
Software Version 402.xx Edition 06/96 11.4 Optimization Dialog
11 - 33
Displaying optimization results for individual jobs:
●
Click on .
●
Click on the lot file containing the job whose results are to be displayed.
The results of Optimization are displayed in the „Optimization results for xx.lose“ window (see Fig.
11.4.3).
●
In the graph click on the green bar of the job.
The results of Optimization are displayed in the „Optimization results for xx.la“ window (see Fig.
11.4.4).
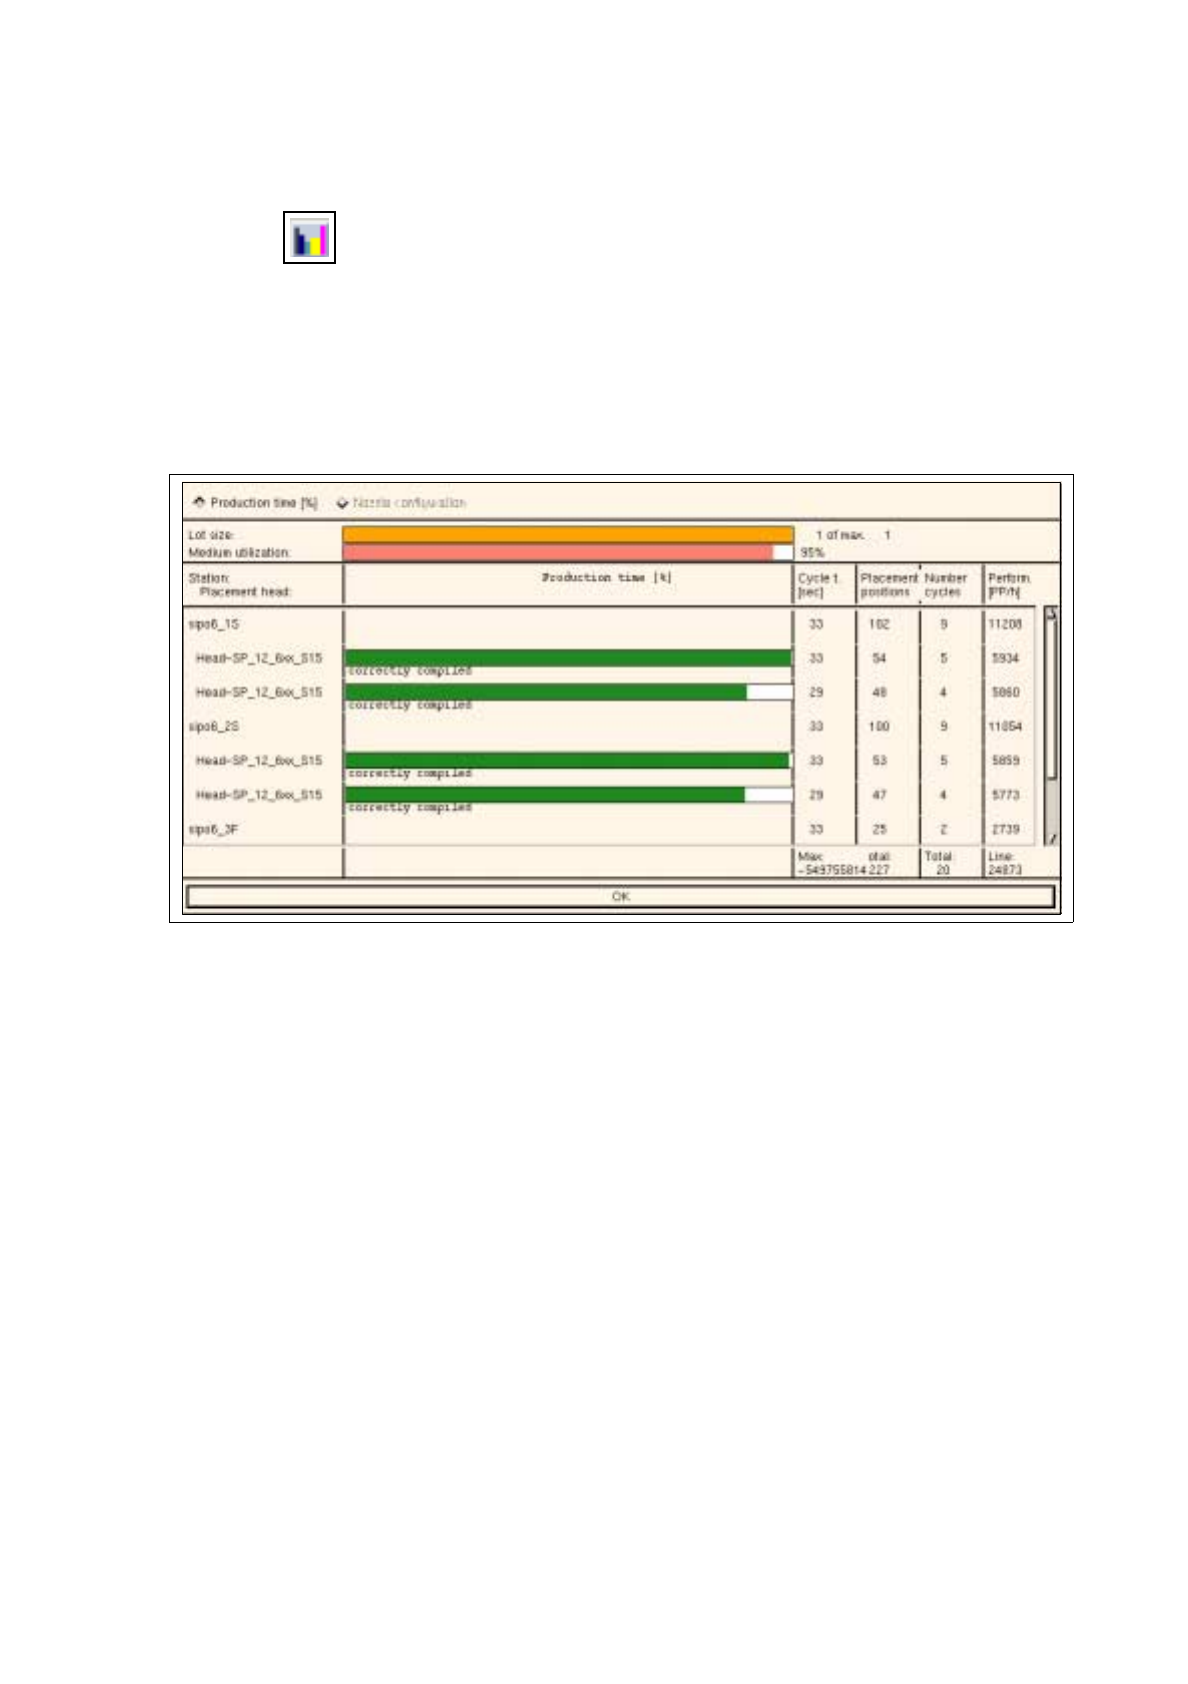
Fig. 11.4.4 „Optimization results xx.la" for a job
In the „Optimization results for xx.la“ window, the following results can be called up:
General results
-
Lot size:
indicates the relation of the lot size of the selected PCB to the maximum lot size within the
lot file.
-
Medium utilization:
indicates the mean value of the placement times per head in relation to the
placement time of the slowest placement head.

11 Production Tools / Optimization User’s Manual Line Computer UNIX
11.4 Optimization Dialog Software Version 402.xx Edition 06/96
11 - 34
Utilization Chart
For each station, each placement head and the entire line, the results of the optimization process are
displayed in the following columns:
-
Production time [%]:
represents the production time for each placement head in the form of a bar.
The red bar indicates the placement heads with the longest production time.
-
Cycle t. [sec]:
indicates the cycle time for each placement head and the total cycle time for each sta-
tion in seconds. The total cycle time of the line additionally comprises all waiting and transport times.
-
Placement positions:
indicates the number of placement positions per placement head and the total
number of placement positions for each station and for the entire line.
-
Number cycles:
indicates the number of cycles per placement head and the total number of cycles
for each station and for the entire line.
-
Perform. [PP/h]:
indicates the placement rate for each placement head and for each station. The total
placement rate of the line additionally comprises all waiting and transport times.
Command field „OK“
Clicking on the "OK" command field causes the window to be closed.
Displaying results of producibility checks for individual jobs:
●
Click on .
●
Click on the lot file containing the job whose results are to be displayed.
The results of Optimization are displayed in the „Optimization results for xx.lose“ window.
●
Click on the job in the „Jobs“ selection field.
The results of the producibility check are displayed in the „Producibility results for xx.la“ window (see
Fig. 11.4.5).
The organization of the „Producibility results for xx.la“ window is identical to that of the „Optimization results
for xx.la“ window described further above.
During the producibility check, the nozzle configuration is determined and can be displayed in this window
for the current job. Clicking on the „Nozzle configuration“ button causes the nozzles required for each head
and for each segment to be displayed.