Tracker-2800-2800S.pdf - 第15页
15 To set the allowed maximu m deviation or “Tolerance” when comparing t he A channel versus the B channel select the MEN U front panel button to displa y the Main menu on the LCD (left image in figure 2-6). Press the SC…
14
2-4 Alternate Mode
The Alternate (ALT) mode of the Tracker 2800 is provided to automatically switch back and forth
between Channel A and Channel B. This allows easy comparison between two devices or the same
points on two circuit boards. The Alternate mode is selected by pressing the ALT button on the front
panel. The alternation frequency is varied by pressing the RATE control button on the Tracker LCD
then pressing the and buttons until the desired alternation frequency is reached. The RATE is
numbered from 1 (fastest) to 10 (slowest). Press the RATE button to return to the power-up menu.
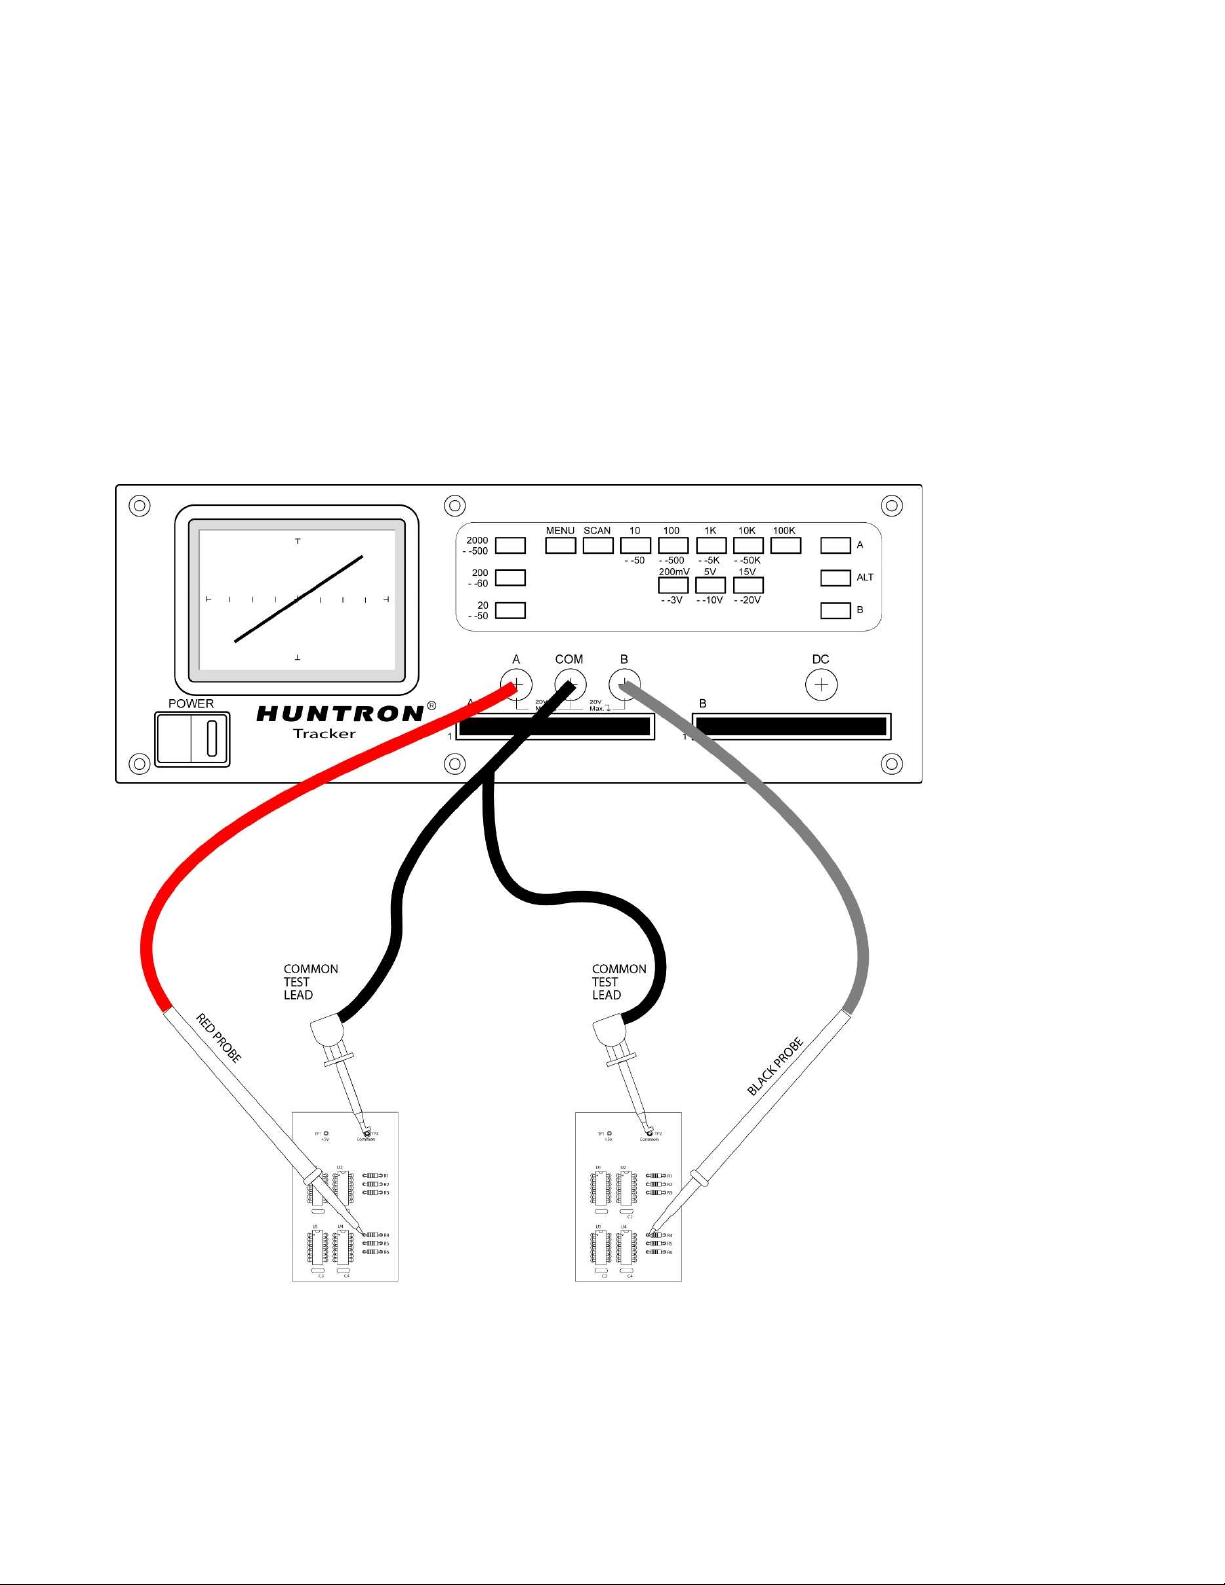
Figure 2-4 shows how the instrument is connected to a known good board and a board under test. This
test mode uses the supplied common test leads to connect two equivalent points on the boards to the
common test terminal. Note that the black probe is plugged into the channel B test terminal.
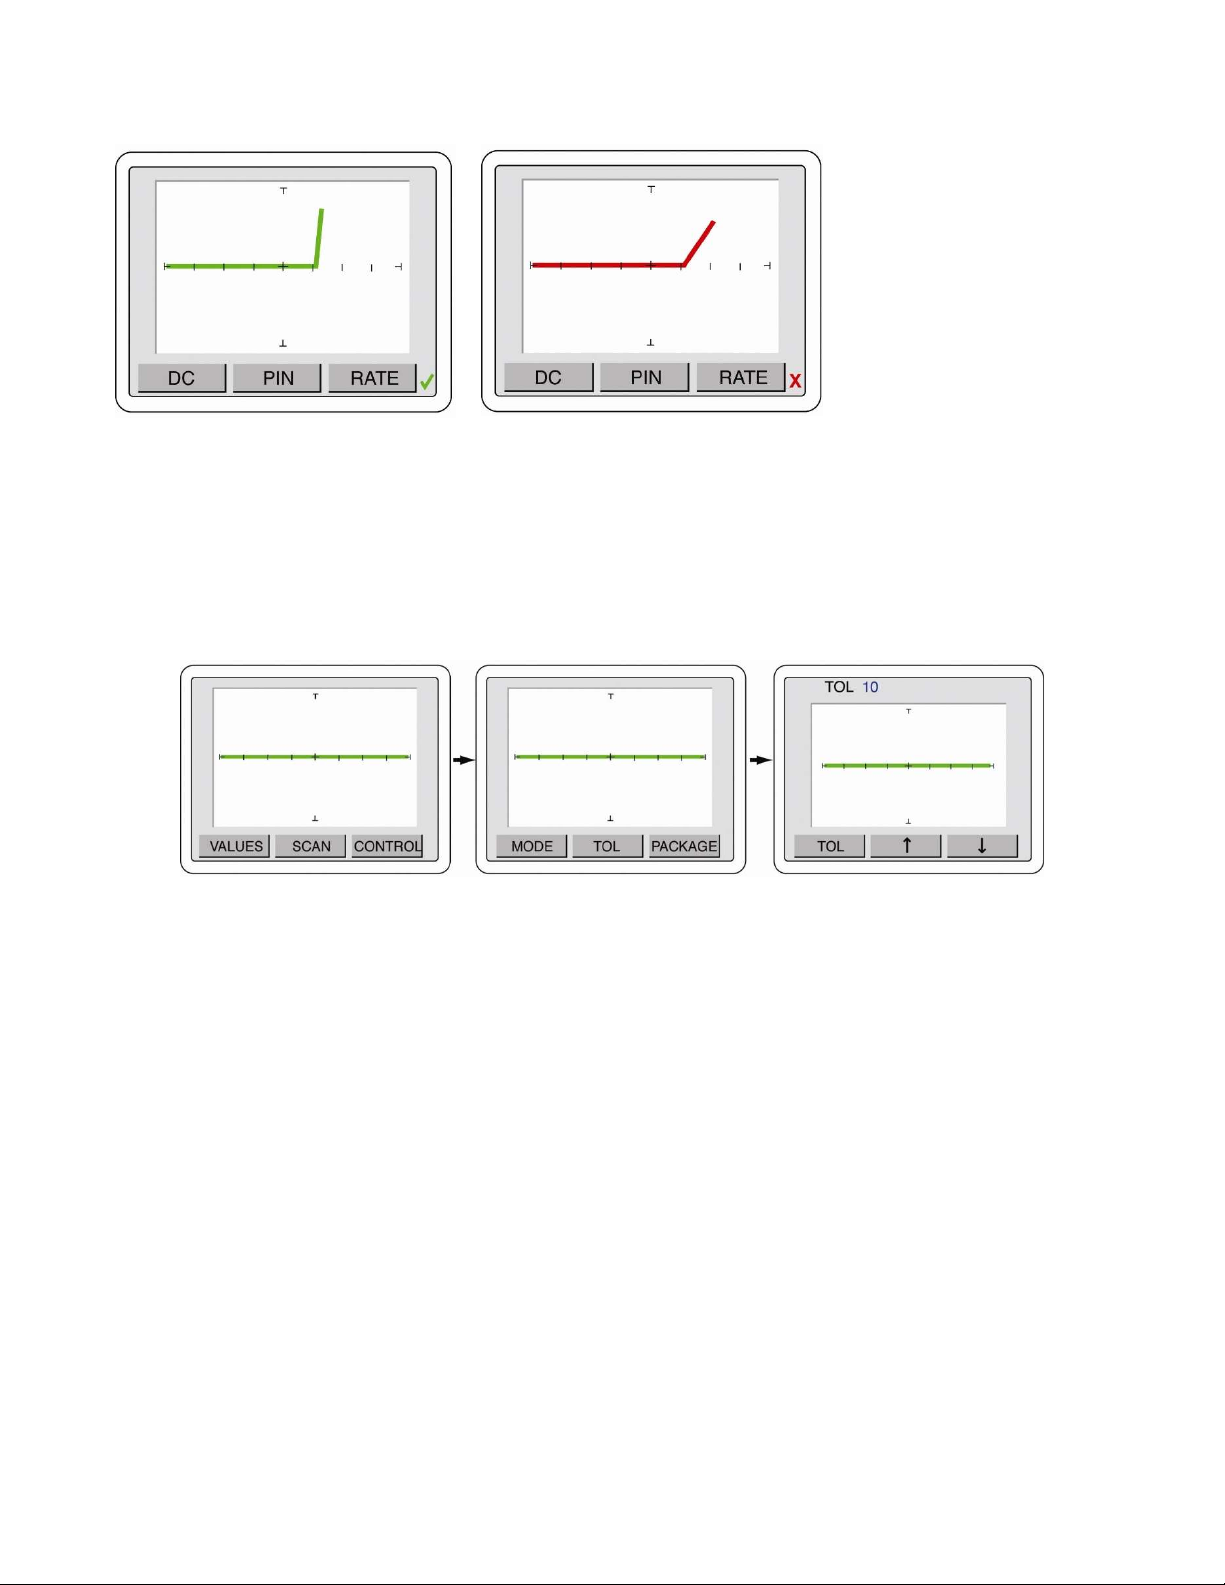
When using ALT mode, a green check mark or red “X” on the bottom right portion of the LCD will
indicate a pass or fail comparison.
Figure 2-4
Channel A and B
with the ALT mode
can be used to make
direct comparisons
of two PCBs.
15
To set the allowed maximum deviation or “Tolerance” when comparing the A channel versus the B
channel select the MENU front panel button to display the Main menu on the LCD (left image in
figure 2-6). Press the SCAN button on the LCD to display the Scan menu (middle image in figure 2-6).
Press TOL to display the Tolerance menu (right image in figure 2-6). Use the and arrow buttons
to adjust the tolerance allowed during comparison. It is adjustable from 0 to 90.
Figure 2-6. Selecting tolerance setting used during A vs. B comparison
2-5 Resistance Selection
The Tracker 2800 is designed with nine resistance ranges (10, 50 100, 500, 1k, 5k, 10k,
50k and 100k). A resistance range is selected by pressing the appropriate button on the front panel.
Each button has a dual function. For example, pressing the 100 button (steady LED indication)
selects 100 as the resistance value. Pressing it again (blinking LED indication) selects 500 as the
resistance value. It is best to start with one of the middle resistance values (i.e. 100 or 1k). If the
signature on the LCD display is close to an open (horizontal trace) select the next higher resistance for
a more descriptive signature. If the signature is close to a short (vertical trace), go the next lower
resistance. An optimum resistive signature is approximately at a 45° angle to the horizontal and
vertical lines of the graticule.
The SCAN feature will allow for sequencing through the resistance ranges at a speed set by the RATE
selected. This feature allows the user to see the signature of a component in different resistance ranges
while keeping their hands free to hold the test leads.
Figure 2-5
LCD displays
indicating a pass
A/B comparison
(green check mark –
left image) and fail
A/B comparison (red
X – right image).
Press the SCAN button Press the TOL button Use and to select the Tolerance

16
2-6 Frequency Selection
Six test signal frequencies (20Hz, 50Hz, 60Hz, 200Hz, 500Hz and 2kHz) can be selected by pressing
the appropriate button on the front panel. Each button has a dual function. For example, pressing the
20Hz button (steady LED indication) selects 20Hz as the test signal frequency. Pressing it again
(blinking LED indication) selects 50Hz as the test signal frequency. Frequency is primarily used to
enhance the signatures of reactive components such as capacitors and inductors.
2-7 Voltage Selection
The voltage selector buttons (200mV/3V, 5V/10V and 15V/20V) allow the user to select the peak
applied sine-wave voltage. Each button has a dual function. For example, pressing the 5V button
(steady LED indication) selects 5 Volts as the test signal’s peak value. Pressing it again (blinking LED
indication) selects 10 Volts as the test signal peak value.
Selection of the voltage value is generally based on the signature shape of tested semiconductors and
the internal operating voltage of a device. It is best to start with a lower voltage of 3V or 5V.
2-8 Analog Signature Analysis (ASA) Basics
Here's how ASA and power-off testing works:
The Tracker 2800 outputs a precision current-limited AC sine wave signal to a component and displays
the resulting current flow, voltage drop and any phase shift on the internal LCD’s display. The current
flow causes a vertical trace deflection on the display, while the voltage across the component causes a
horizontal trace deflection. This resultant trace on the display is called an analog signature.
Understanding the Tracker 2800's basic core circuit is the key to understanding how analog signatures
respond to different types of components. Since the induced current is a function of the impedance of
the circuit, the analog signature displayed can be thought of as a visual representation of Ohm’s Law,
V = IR where V = voltage, I = current and R = resistance
The next figure shows a simplified diagram of the Tracker’s core circuit. The sine wave generator is
the test signal source and is connected to a resistor voltage divider made up of R
s
and R
L
. The load
impedance, R
L
, is the impedance of the component under test. R
L
is in series with the Tracker 2800's
internal or source impedance R
s
. Because R
s
is constant, both the voltage across the component under
test and the current through it is a sole function of R
L
.