Tracker-2800-2800S.pdf - 第43页
43 has a signature that looks si milar to an open circuit. And l ikewise, the same capacitor at a hi gh frequency has a signature that 's similar to a short circuit. Effect of Changin g Frequency on a 0.1 F Capaci…
42
The device to be tested must have all power turned off and have all high voltage capacitors
discharged before connecting the Tracker 2800 to the device.
Do the following to display the analog signature of a capacitor:
1. Select the 10V, 50 and 60Hz range
2. Place or clip a test lead on the opposite ends of a capacitor and observe the signature.
The Signatures of Different Capacitors
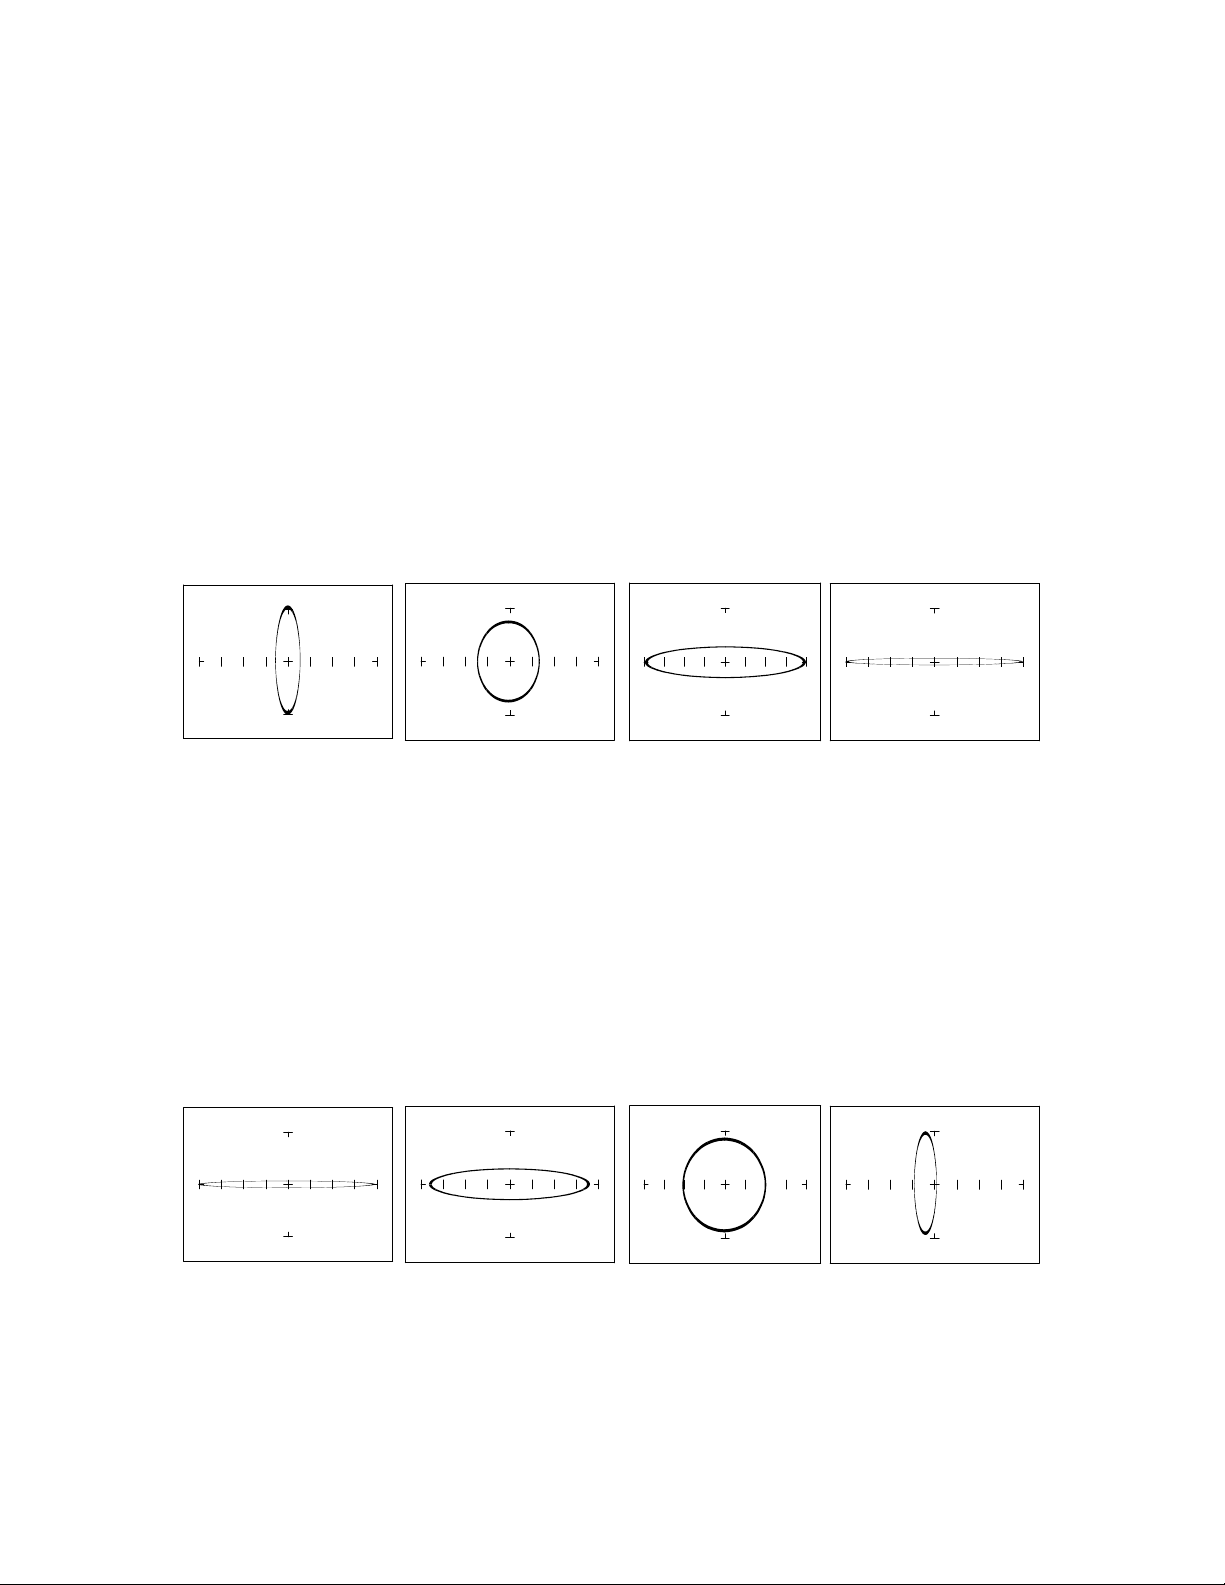
The figure below shows analog signatures for four different value capacitors, 1000 f, 100 f, 10 f
and 1f. Select 10V, 50 and 60Hz.
1000 µF 100 µF 10 µF 1 µF
Figure 3-8. Signatures of 4 Capacitors in the 10V, 50 and 60Hz Range.
Note that as the capacitance values decrease, each signature changes from a vertical elliptical pattern to
a horizontal elliptical pattern. In ASA, a large value capacitor has a signature that looks similar to a
short circuit. And likewise, a small value capacitor has a signature that's similar to an open circuit.
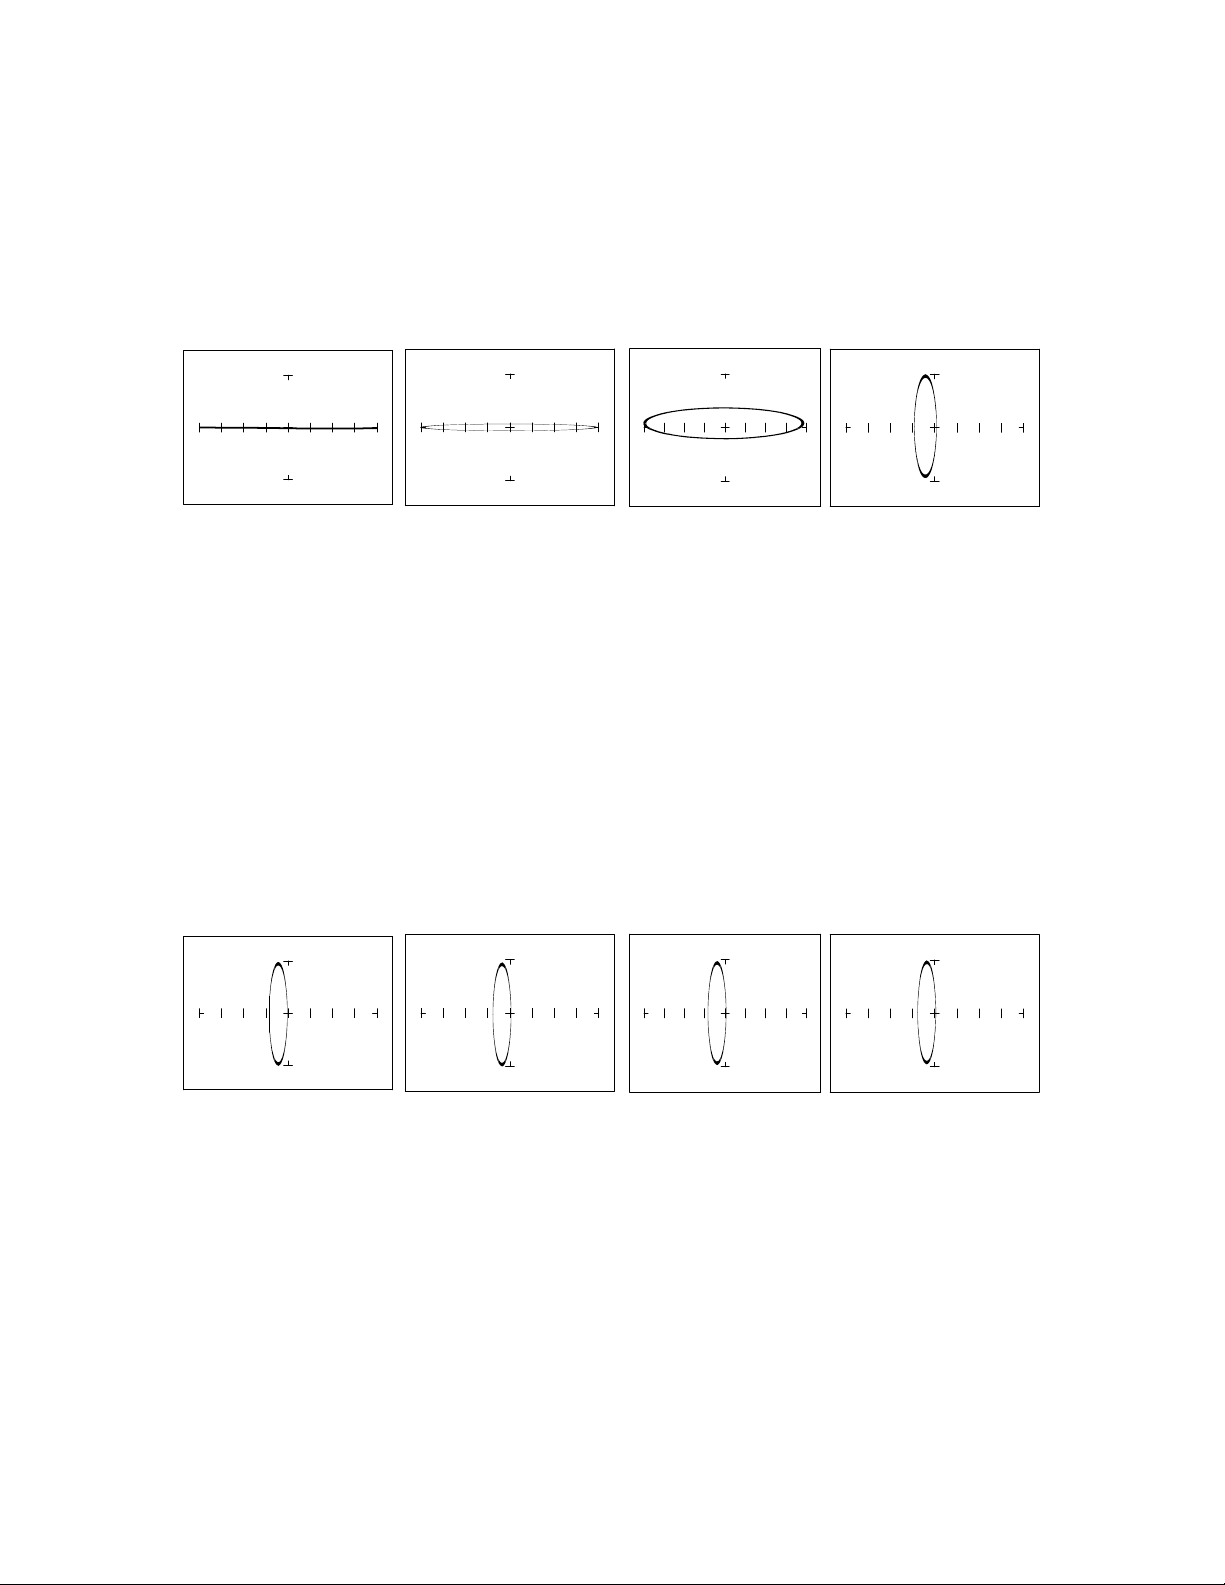
Effect of Changing Frequency on a 10F Capacitor
Select 10V, 50 and 20Hz. Then select 60Hz, 500Hz and 2KHz.
F
S
= 20Hz F
S
= 60Hz F
S
= 500Hz F
S
= 2KHz
Figure 3-9. Signatures of a 10F Capacitor at Different Frequencies
Note that as the test signal frequency increases, the 10 F capacitor's signature changes from a
horizontal elliptical pattern to a vertical elliptical pattern. In ASA, a capacitor at a low test frequency
43
has a signature that looks similar to an open circuit. And likewise, the same capacitor at a high
frequency has a signature that's similar to a short circuit.
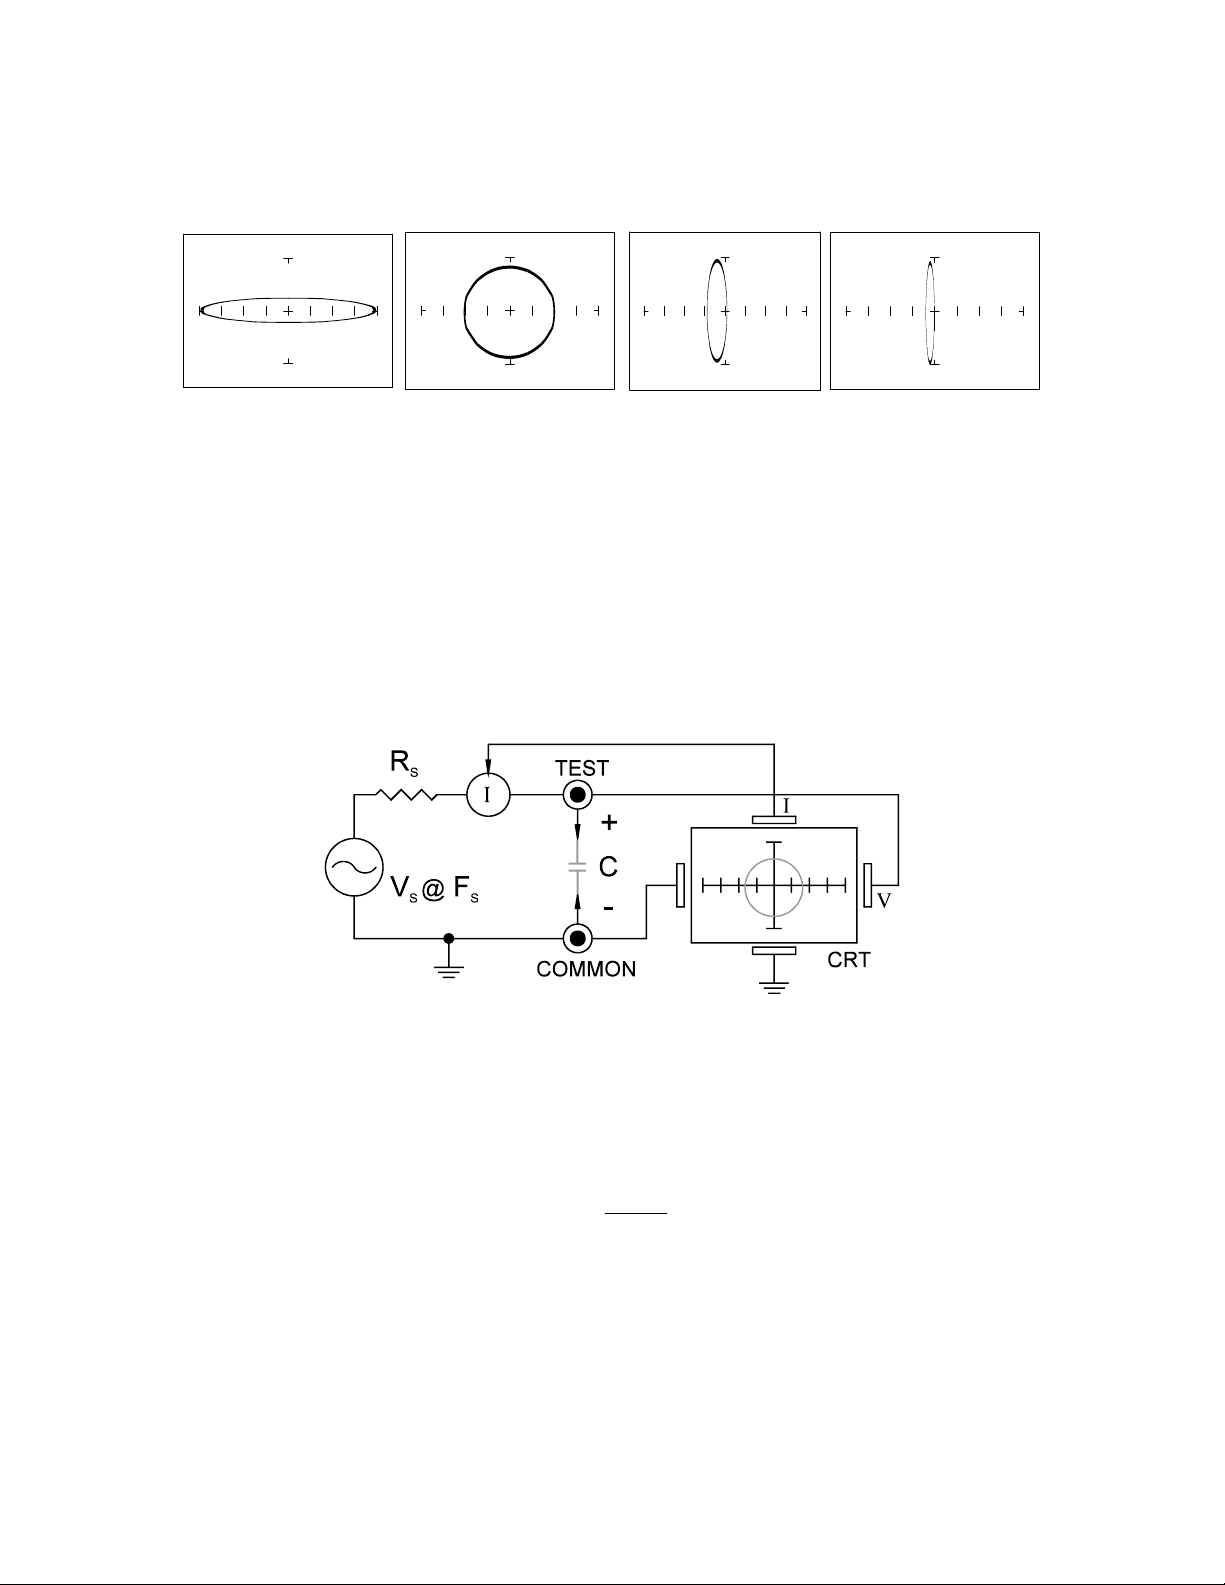
Effect of Changing Frequency on a 0.1F Capacitor
Select 10V, 1K and 20Hz. Then select 60Hz, 500Hz and 2KHz.
F
S
= 20 Hz F
S
= 60 Hz F
S
= 500 Hz F
S
= 2 kHz
Figure 3-10. Signatures of a 0.1 F Capacitor at Different Frequencies.
Note that as the test signal frequency increases, each signature changes from a horizontal elliptical
pattern to a vertical elliptical pattern. In ASA, a small value capacitor at a low test frequency has a
signature that looks similar to a short circuit. And likewise, a small value capacitor at a high test
frequency has a signature that's similar to an open circuit. The signature of the 0.1 F capacitor is
similar to the 10 F capacitor in shape but not in size due to the differences in their value.
Effect of Changing Voltage on a 1F Capacitor
Select 200mV, 20K and 60Hz. Then select 5V, 15V and 20V.
V
S
= 200mV V
S
= 5V V
S
= 15V V
S
= 20V
Figure 3-11. Signatures of a 1 F Capacitor at Different Test Signal Voltages.
As V
S,
the test signal voltage increases from low to high, the signatures did not change.
44
Effect of Changing Resistance on a 1F Capacitor
Select 15V, 1K and 60Hz. Then select 5K, 10K and 100K.
R
S
= 1K R
S
= 5K R
S
= 10K R
S
= 100K
Figure 3-12. Signatures of a 1F Capacitor at Different Internal Resistances.
As the Tracker 2800's internal resistance R
S
decreased, the capacitor's signature changes from a
horizontal elliptical pattern to a vertical elliptical pattern. In ASA, a large internal resistance value
results in a capacitor signature that looks similar to an open circuit. And likewise, a small internal
resistance value results in a capacitor signature that's similar to a short circuit.
Understanding Capacitive Signatures
Figure 3-13. Tracker 2800 Core Circuit Block Diagram with a Capacitor.
The Huntron Workstation Software displays the Tracker 2800 signature as a response to its test signal,
an analog signature that represents the relationship between voltage, current and resistance of a
component. For circuits that contain capacitors, the effective resistance is called capacitive reactance,
X
C
. The mathematical formula is:
X
c
=
1
2 fC
X
C
is inversely related to both capacitance and frequency. To review and summarize capacitive analog
signatures up to this point:
Changing capacitance: As the capacitance of a circuit increases, the capacitive reactance X
C
decreases. This means that when capacitance increases, the amount of current in the component or
circuit will increase. On the Tracker 2800, the elliptical signature will become increasingly vertical
that implies more current flow.