Tracker-2800-2800S.pdf - 第44页
44 Effect of Changin g Resistance on a 1 F Capacitor Select 15V, 1K and 60Hz. The n select 5K, 10K and 100K. R S = 1K R S = 5K R S = 10K R S = 100K Figure 3-12 . Signatures of a 1 F Capacitor at Dif ferent In…
43
has a signature that looks similar to an open circuit. And likewise, the same capacitor at a high
frequency has a signature that's similar to a short circuit.
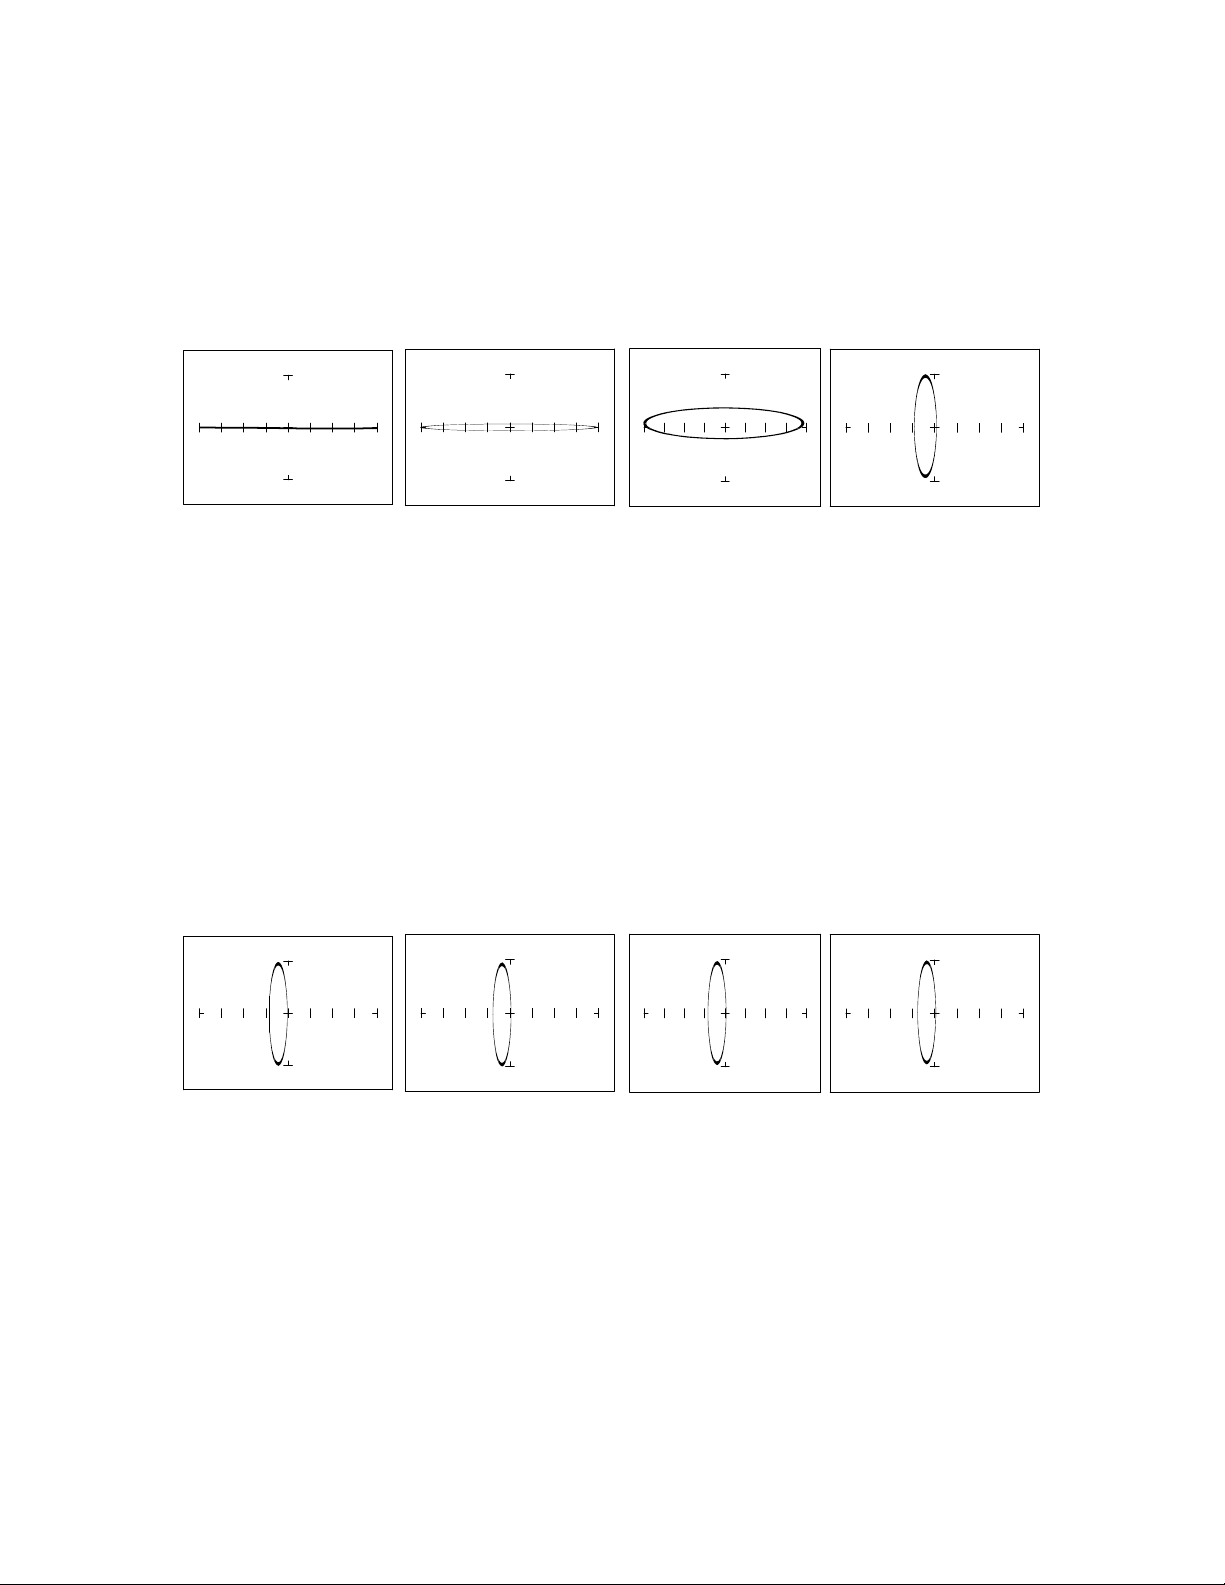
Effect of Changing Frequency on a 0.1F Capacitor
Select 10V, 1K and 20Hz. Then select 60Hz, 500Hz and 2KHz.
F
S
= 20 Hz F
S
= 60 Hz F
S
= 500 Hz F
S
= 2 kHz
Figure 3-10. Signatures of a 0.1 F Capacitor at Different Frequencies.
Note that as the test signal frequency increases, each signature changes from a horizontal elliptical
pattern to a vertical elliptical pattern. In ASA, a small value capacitor at a low test frequency has a
signature that looks similar to a short circuit. And likewise, a small value capacitor at a high test
frequency has a signature that's similar to an open circuit. The signature of the 0.1 F capacitor is
similar to the 10 F capacitor in shape but not in size due to the differences in their value.
Effect of Changing Voltage on a 1F Capacitor
Select 200mV, 20K and 60Hz. Then select 5V, 15V and 20V.
V
S
= 200mV V
S
= 5V V
S
= 15V V
S
= 20V
Figure 3-11. Signatures of a 1 F Capacitor at Different Test Signal Voltages.
As V
S,
the test signal voltage increases from low to high, the signatures did not change.
44
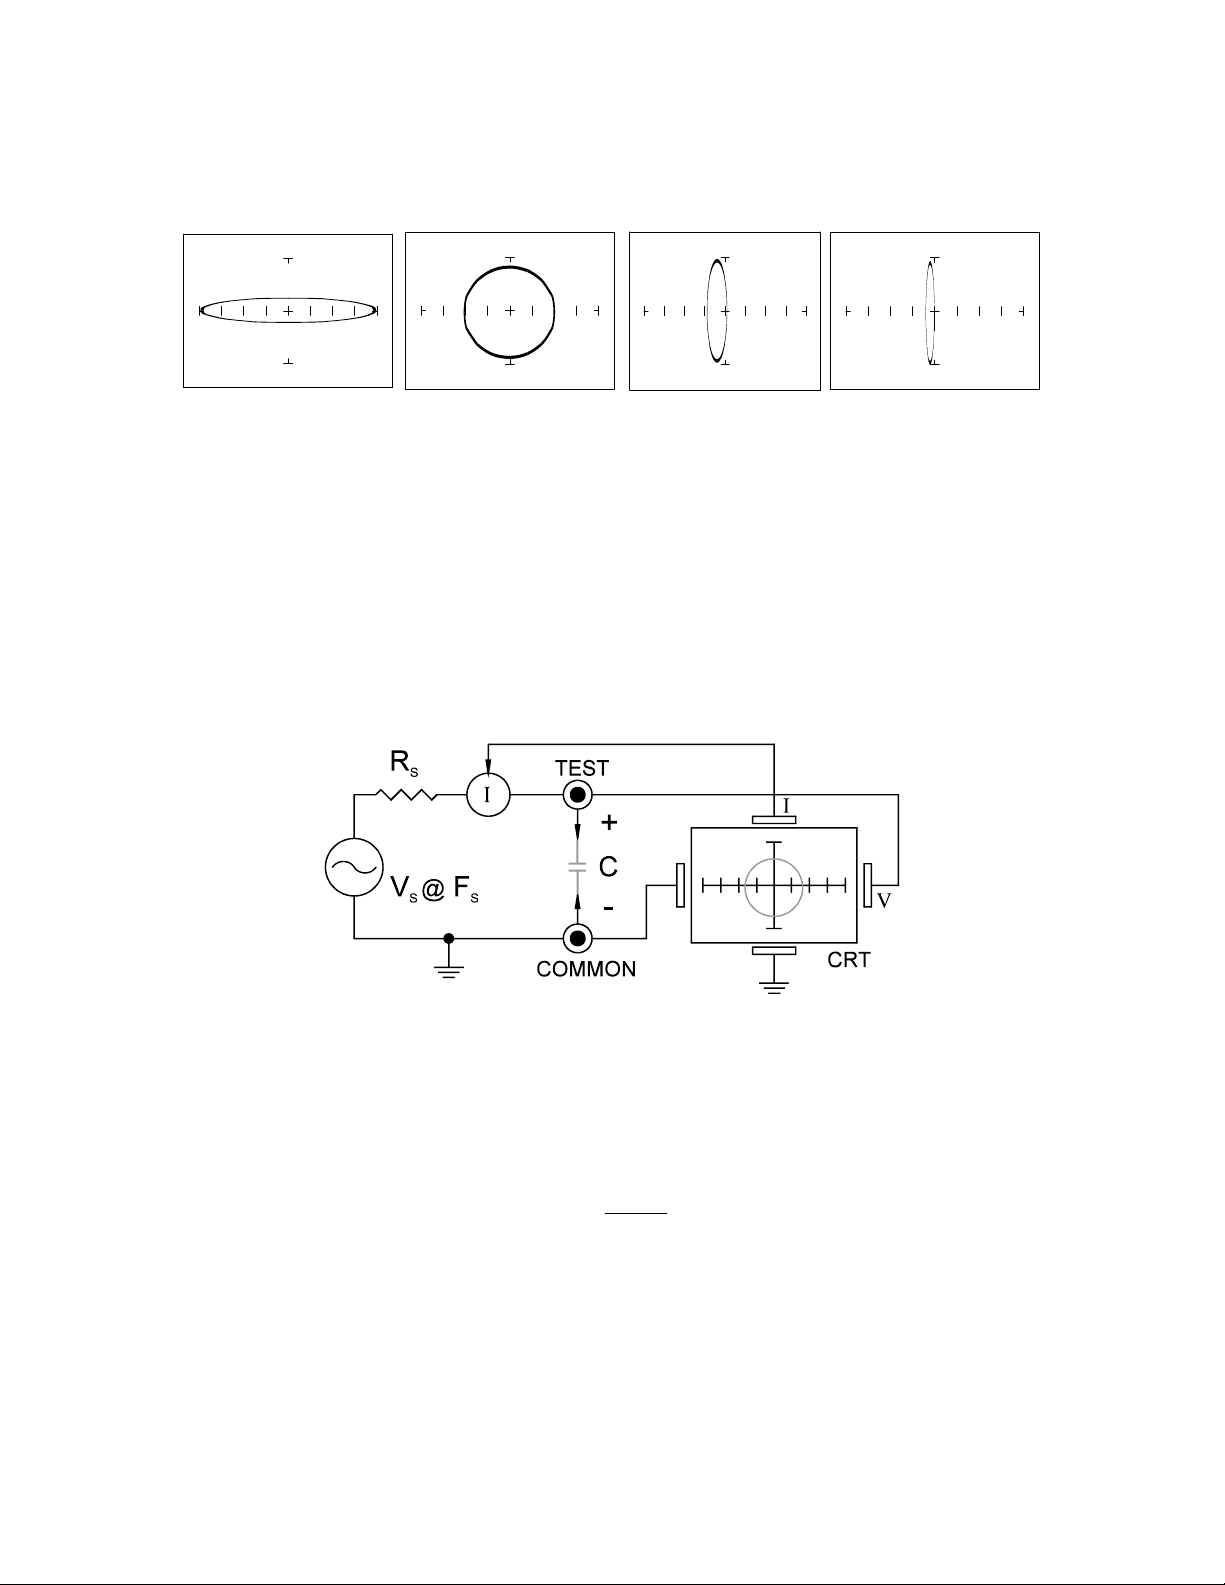
Effect of Changing Resistance on a 1F Capacitor
Select 15V, 1K and 60Hz. Then select 5K, 10K and 100K.
R
S
= 1K R
S
= 5K R
S
= 10K R
S
= 100K
Figure 3-12. Signatures of a 1F Capacitor at Different Internal Resistances.
As the Tracker 2800's internal resistance R
S
decreased, the capacitor's signature changes from a
horizontal elliptical pattern to a vertical elliptical pattern. In ASA, a large internal resistance value
results in a capacitor signature that looks similar to an open circuit. And likewise, a small internal
resistance value results in a capacitor signature that's similar to a short circuit.
Understanding Capacitive Signatures
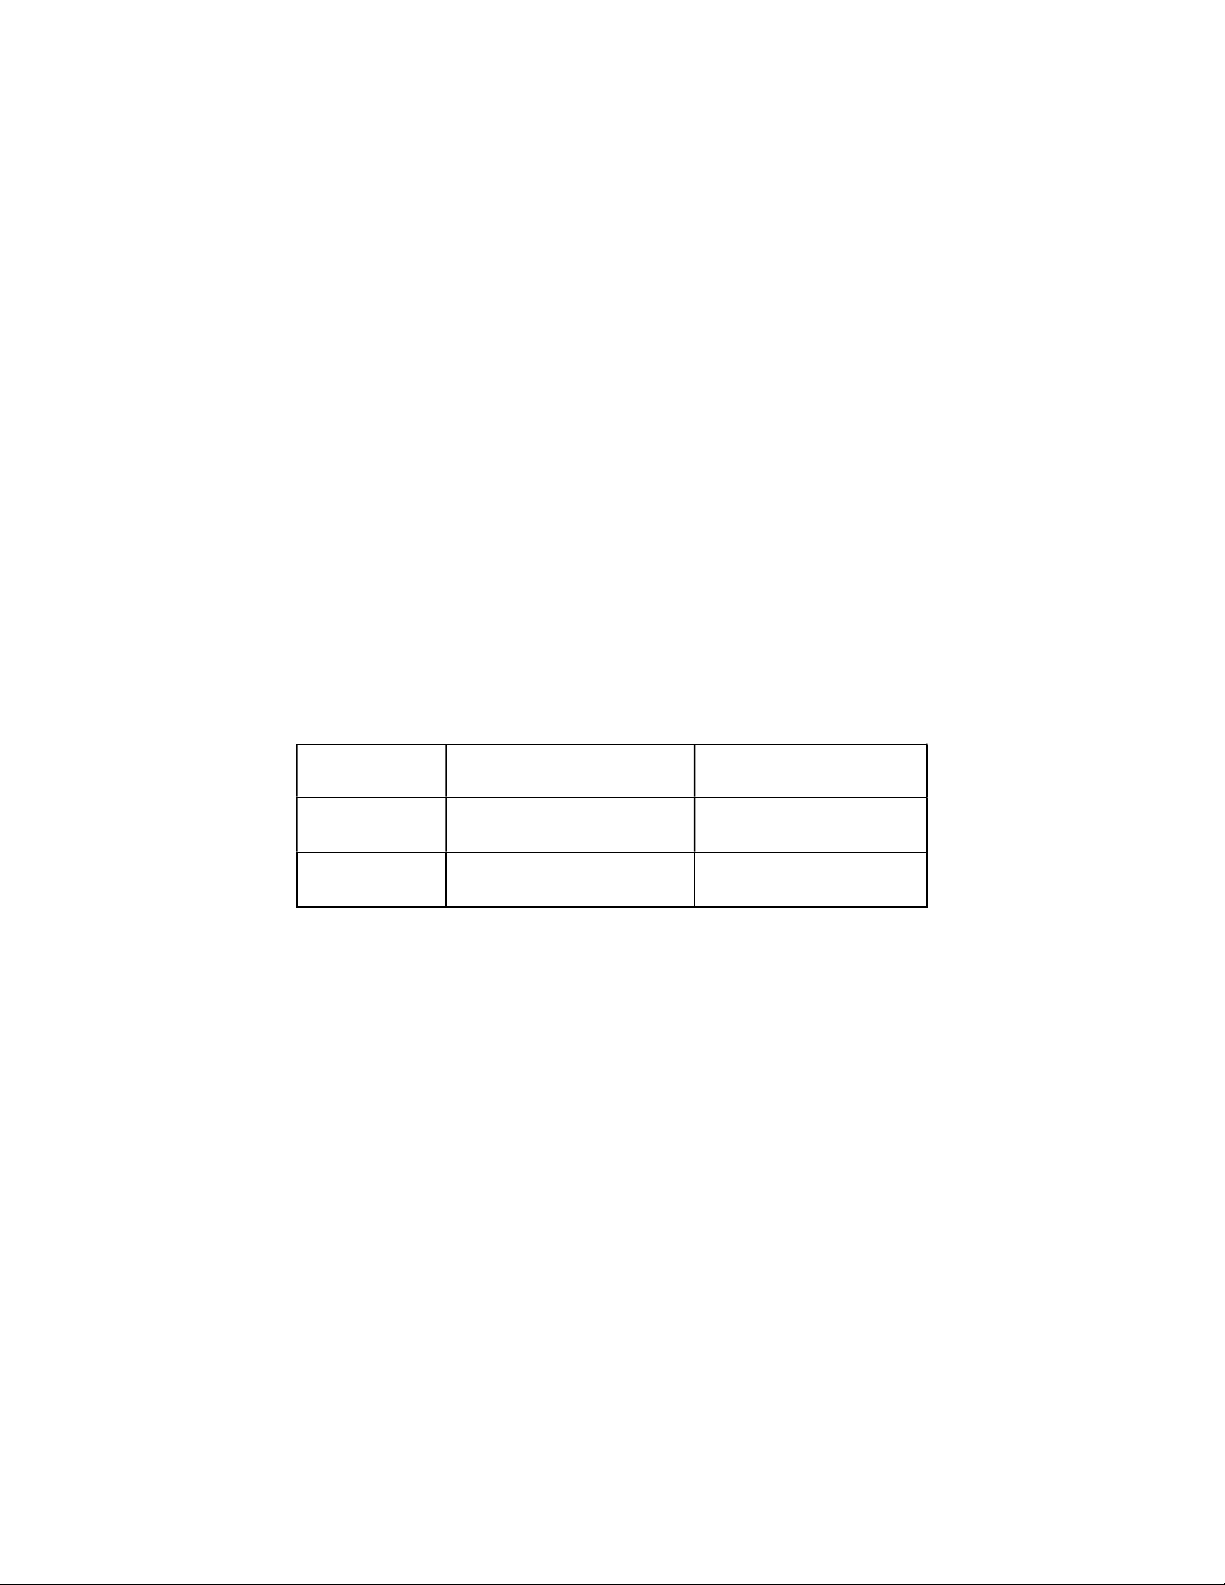
Figure 3-13. Tracker 2800 Core Circuit Block Diagram with a Capacitor.
The Huntron Workstation Software displays the Tracker 2800 signature as a response to its test signal,
an analog signature that represents the relationship between voltage, current and resistance of a
component. For circuits that contain capacitors, the effective resistance is called capacitive reactance,
X
C
. The mathematical formula is:
X
c
=
1
2 fC
X
C
is inversely related to both capacitance and frequency. To review and summarize capacitive analog
signatures up to this point:
Changing capacitance: As the capacitance of a circuit increases, the capacitive reactance X
C
decreases. This means that when capacitance increases, the amount of current in the component or
circuit will increase. On the Tracker 2800, the elliptical signature will become increasingly vertical
that implies more current flow.
45
Changing frequency F
S
: As the frequency of the test signal increases, the capacitive reactance X
C
will decrease and the amount of current in the circuit will increase. On the Tracker 2800, the
elliptical signature will become increasingly vertical that implies more current flow.
Changing voltage V
S
: As the test signal voltage is changed from 200 mV to 20 V, the following
occurs:
X
C
of the capacitor is not affected
The applied V increases
The elliptical signature is not affected
Changing source resistance R
S
: As the resistance is changed from 1 k to 100 k, the following
occurs:
X
C
of the capacitor is not affected
V
S
increases so current decreases proportionately
The elliptical signature becomes increasingly vertical
Table 3-1 shows the Tracker 2800's limits for the minimum and maximum capacitance values that will
display a usable signature on the Tracker display.
R
S
F
S
=
20 Hz. F
S
= 2 kHz
100 k 0.01 F - 1 F 100 pF - 0.01 F
10 15,000 F - 100 F 0.1 F - 100 F
Table 3-1. Tracker 2800 Minimum and Maximum Capacitor Values.
Capacitor Failures – Leakage
One common physical failure in capacitors is dielectric leakage. The dielectric or insulator in a
capacitor normally acts as a non-conductor between the capacitor's two plates. A flawed capacitor
develops a conductive or leakage path between its two plates. This can be thought of as a resistance in
parallel with the capacitance when observing its signature. These examples show what some capacitor
leakage problems may look like in the Tracker 2800 signature display with 50, 10V and 60Hz
selected.