Tracker-2800-2800S.pdf - 第46页
46 Normal Capacitor Leaky Capacitor Figure 3 -15. Signatures of A 100 F Capacitor w ith Dielectric Le akage. This example onl y simulates t he leakage flaw b y adding a 100 resistor in parallel to a 100 F capacitor…

45
Changing frequency F
S
: As the frequency of the test signal increases, the capacitive reactance X
C
will decrease and the amount of current in the circuit will increase. On the Tracker 2800, the
elliptical signature will become increasingly vertical that implies more current flow.
Changing voltage V
S
: As the test signal voltage is changed from 200 mV to 20 V, the following
occurs:
X
C
of the capacitor is not affected
The applied V increases
The elliptical signature is not affected
Changing source resistance R
S
: As the resistance is changed from 1 k to 100 k, the following
occurs:
X
C
of the capacitor is not affected
V
S
increases so current decreases proportionately
The elliptical signature becomes increasingly vertical
Table 3-1 shows the Tracker 2800's limits for the minimum and maximum capacitance values that will
display a usable signature on the Tracker display.
R
S
F
S
=
20 Hz. F
S
= 2 kHz
100 k 0.01 F - 1 F 100 pF - 0.01 F
10 15,000 F - 100 F 0.1 F - 100 F
Table 3-1. Tracker 2800 Minimum and Maximum Capacitor Values.
Capacitor Failures – Leakage
One common physical failure in capacitors is dielectric leakage. The dielectric or insulator in a
capacitor normally acts as a non-conductor between the capacitor's two plates. A flawed capacitor
develops a conductive or leakage path between its two plates. This can be thought of as a resistance in
parallel with the capacitance when observing its signature. These examples show what some capacitor
leakage problems may look like in the Tracker 2800 signature display with 50, 10V and 60Hz
selected.
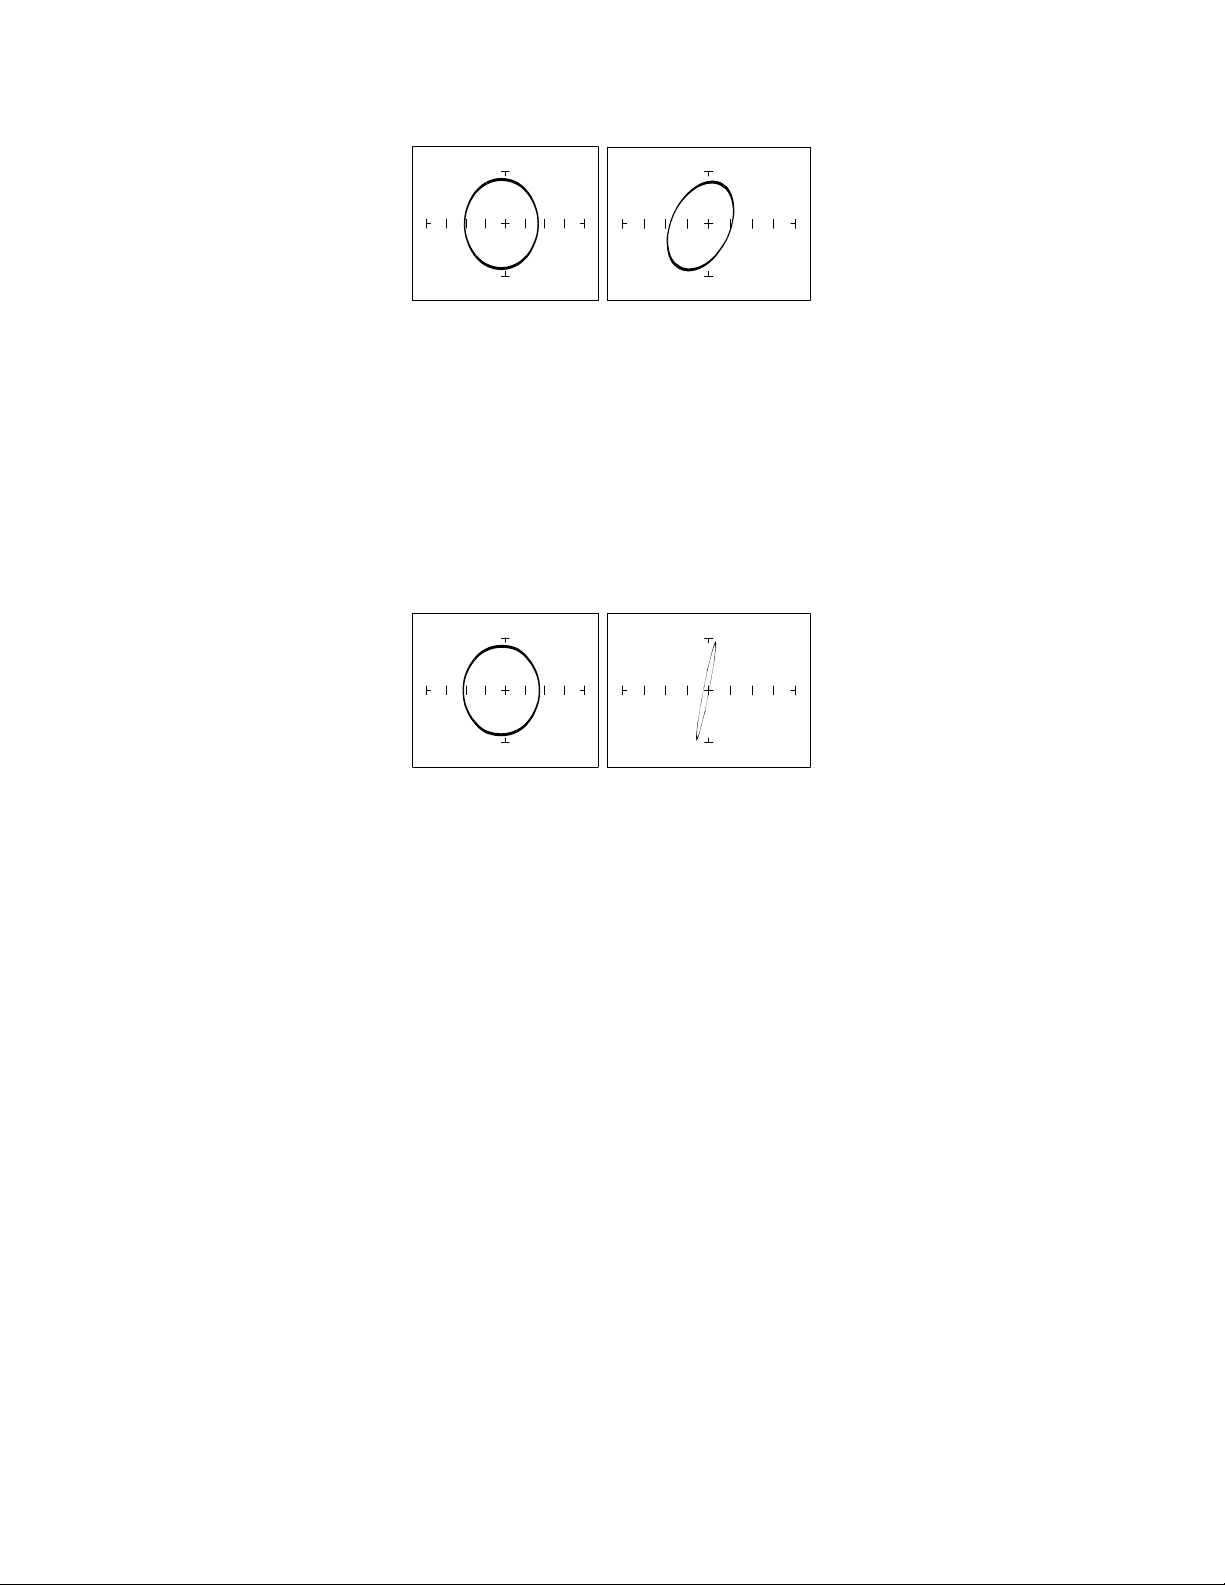
46
Normal Capacitor Leaky Capacitor
Figure 3-15. Signatures of A 100 F Capacitor with Dielectric Leakage.
This example only simulates the leakage flaw by adding a 100 resistor in parallel to a 100 F
capacitor. It shows the signature change from a normal circular ellipse pattern to a sloped and
depressed vertical pattern. The signature of a real capacitive leakage would be quite similar to this
example.
Another example of capacitive leakage is shown for a 10 F capacitor.
Normal Capacitor Leaky Capacitor
Figure 3-16. Signatures of a 10 F Capacitor with Dielectric Leakage at 10V, 500, 60Hz
Again, this example only simulates the leakage flaw by adding a 68 resistor in parallel to a 10 F
capacitor. It shows the signature change from a normal circular ellipse pattern to a sloped and
depressed vertical pattern. The signature of a real capacitive leakage would be quite similar to this
example.
As you can see from the two previous examples, adding resistance in parallel to a capacitor distorts the
normal signature with a diagonal bend to it. This is our first look at a composite signature, the kind of
signature the Tracker 2800 displays when there are several components connected together in a circuit.
Review
Capacitors have elliptical signatures due to the current and voltage phase shift.
As the test signal's frequency increases, the capacitor's signature becomes more vertical due to
decreasing X
C
of the component.
Capacitors with leakage flaws have their ellipses tilted diagonally due to an internal resistance in
parallel with the capacitance.

47
Applications
The Tracker 2800 can locate defective capacitors in or out of circuit. The ranges cover 100 pF to
15,000 F.
When analyzing a capacitor's signature, adjust the Tracker 2800's R
S
and F
S
for the most
pronounced ellipse.
The test signal frequency F
S,
can be changed to enhance a composite signature by emphasizing or
de-emphasizing the capacitance.
Besides resistance, faulty capacitor signatures often exhibit other irregularities such as non-
symmetry, broken or distorted ellipse and saw-toothed shapes that can be seen in the signature
display.