Tracker-2800-2800S.pdf - 第19页
19 Figure 2-9 Tracker 2800 LCD Display with Open Test Terminals. Vertical Axis The amount of vertical trace deflecti on on the LCD displa y is controlled by the voltage dropped across the internal impedance R s of the Tr…
18
Range Volts/Div
20V 5.00
15 V 3.75
10 V 2.50
5 V 1.25
3 V 0.75
200 mV 0.05
Table 2-3 Tracker 2800 Horizontal Sensitivities
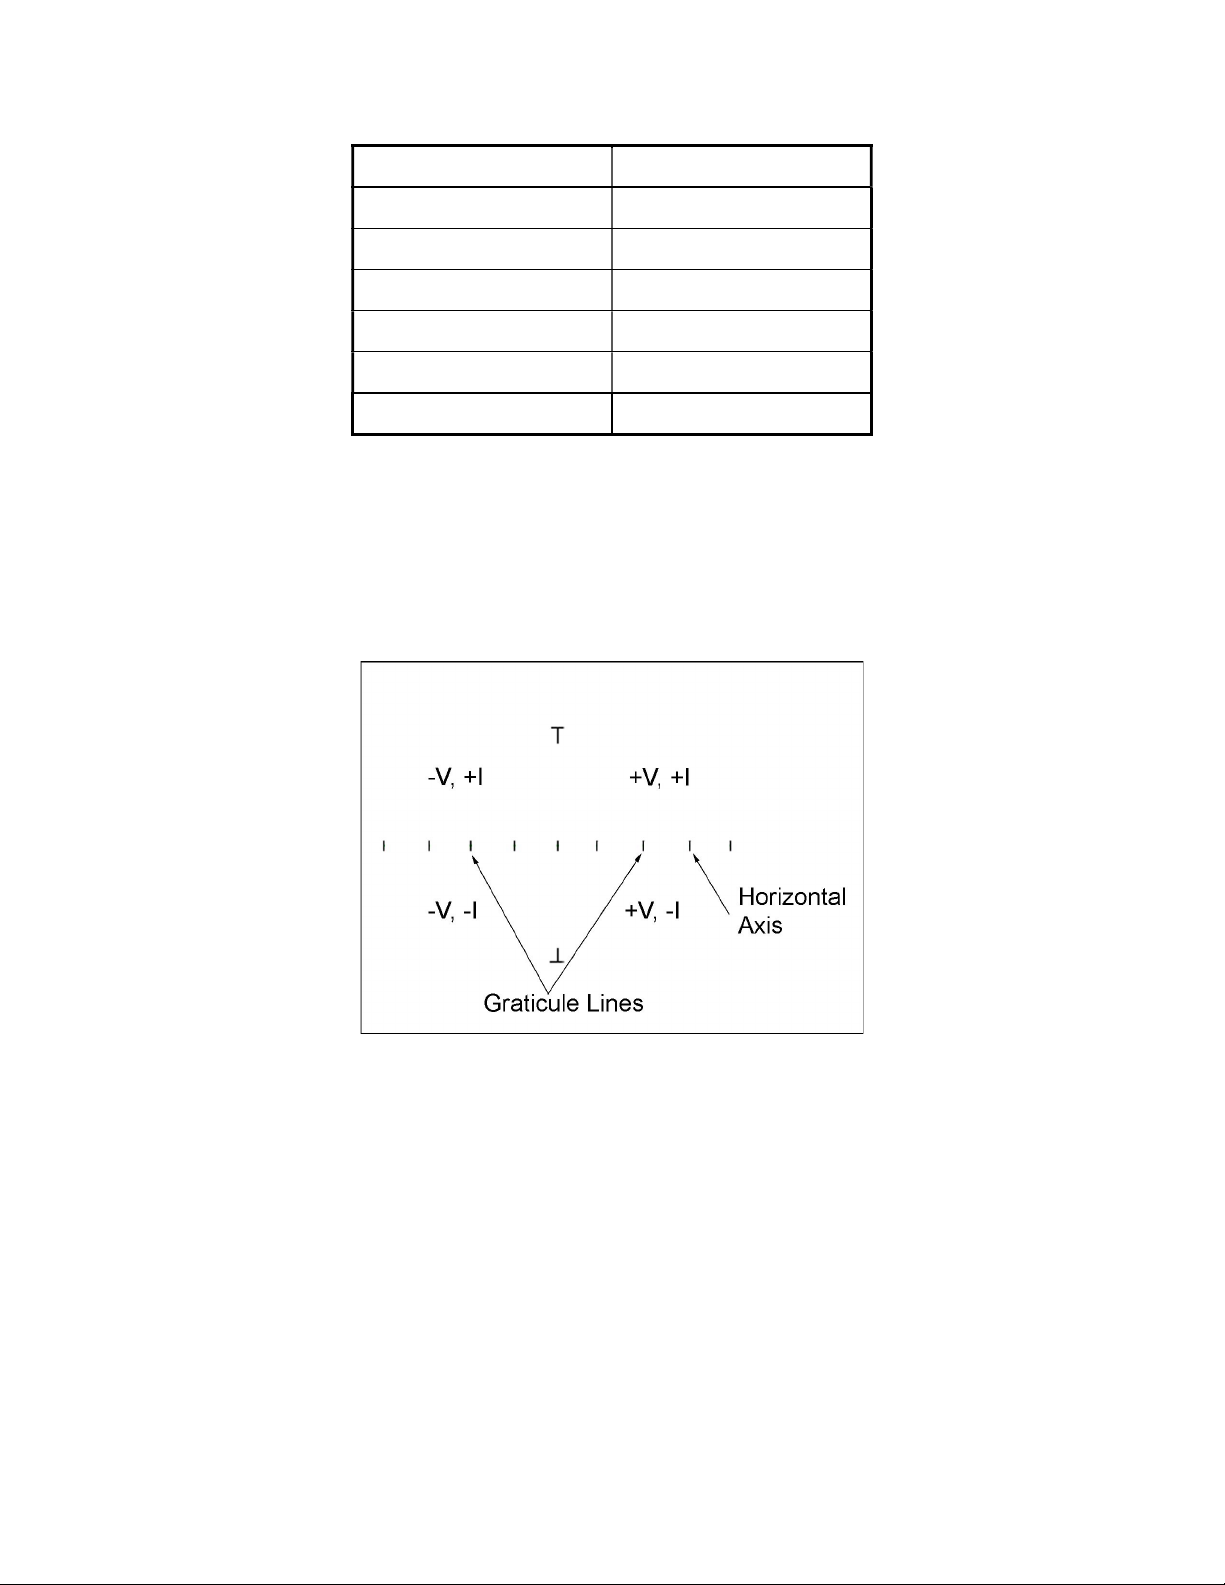
The Signature viewing area of the LCD screen can also be set up in quadrants to show positive and
negative current and voltage characteristics. Refer to figure 2-8.
Figure 2-8. LCD Display Horizontal Axis and Graticule Lines.
When the test signal is positive, this means that the voltage and current are positive so the signature's
trace is on the right hand side of the LCD display. When the test signal is negative, the voltage and
current are negative so the trace is in the left hand side of the display.
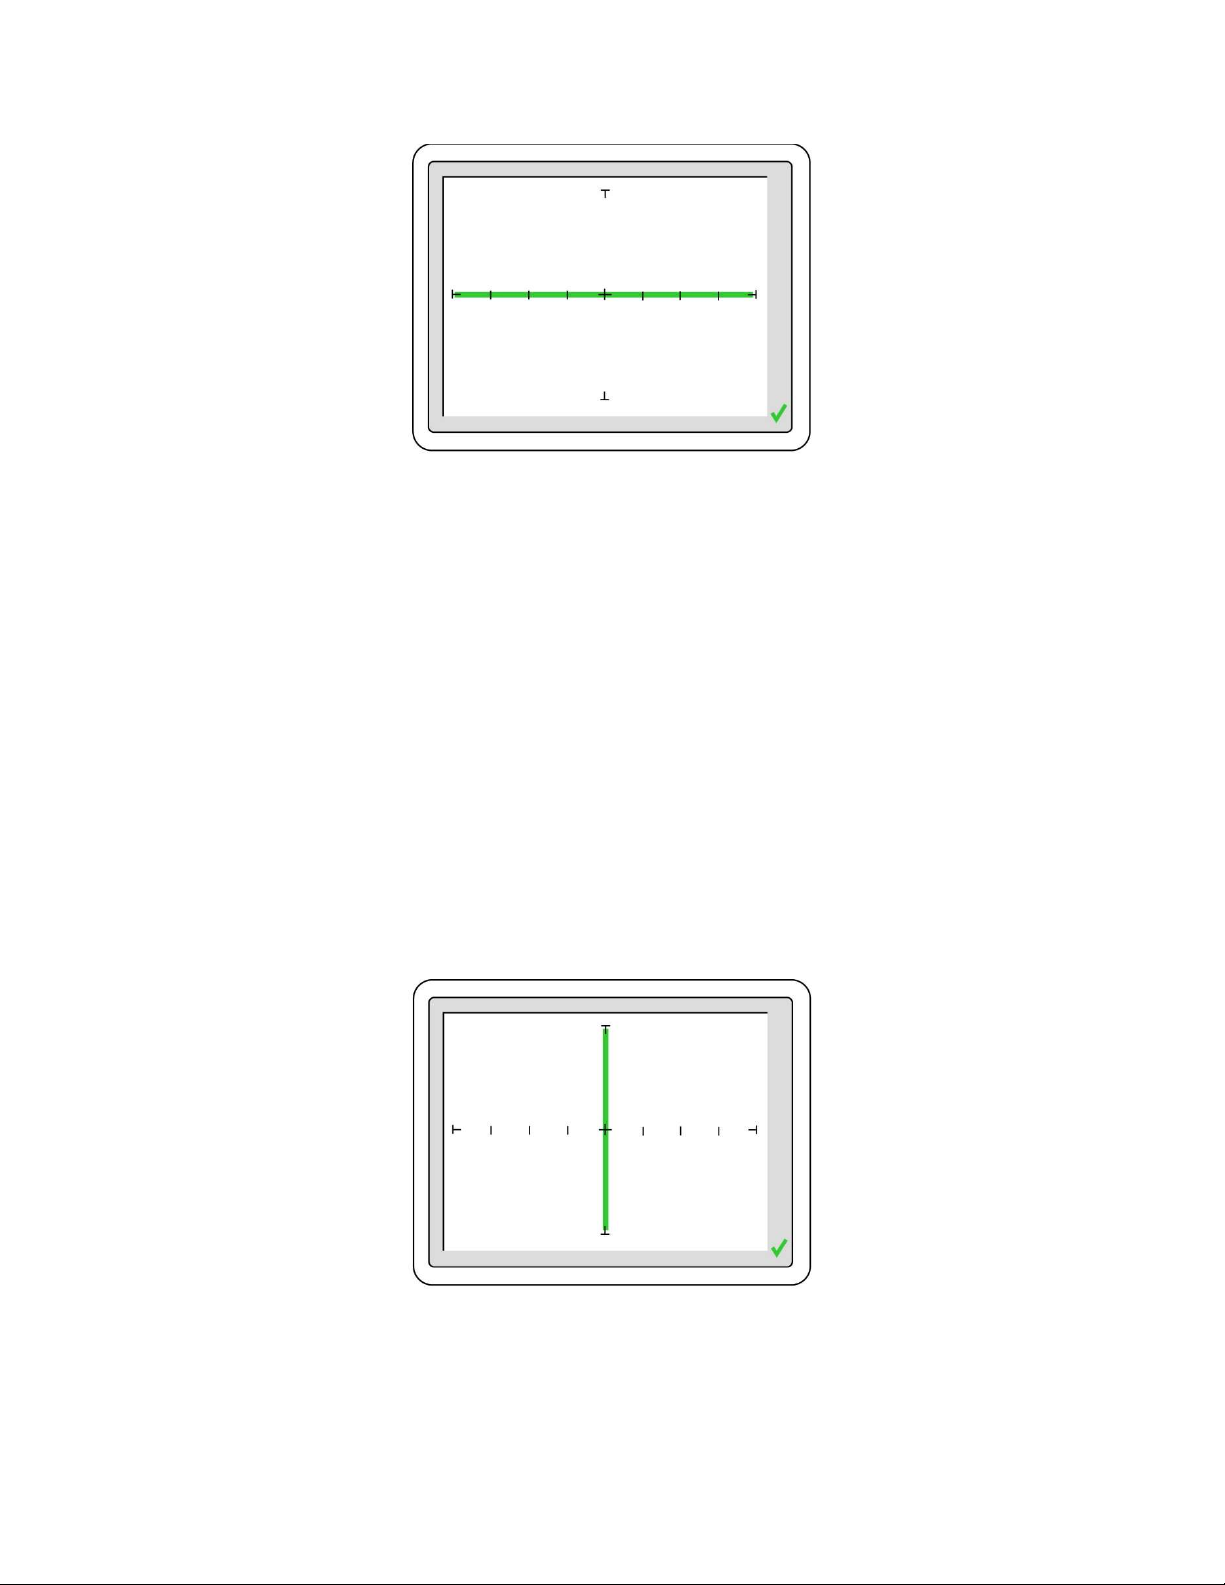
Turn on the Tracker 2800 and observe the LCD display. With nothing connected to its test terminals,
the display trace is a horizontal line (R
L
=) as shown in figure 2-9.
19
Figure 2-9 Tracker 2800 LCD Display with Open Test Terminals.
Vertical Axis
The amount of vertical trace deflection on the LCD display is controlled by the voltage dropped across
the internal impedance R
s
of the Tracker. Because R
s
is in series with the load R
L
, this voltage will be
proportional to the current flowing through R
L
. This current that flows through the component under
test is the vertical part of the signature.
When the R
L
is zero ohms (0) by shorting the output terminal to the common terminal, there is no
voltage dropped across R
L
causing no horizontal component displayed in the Tracker signature. This
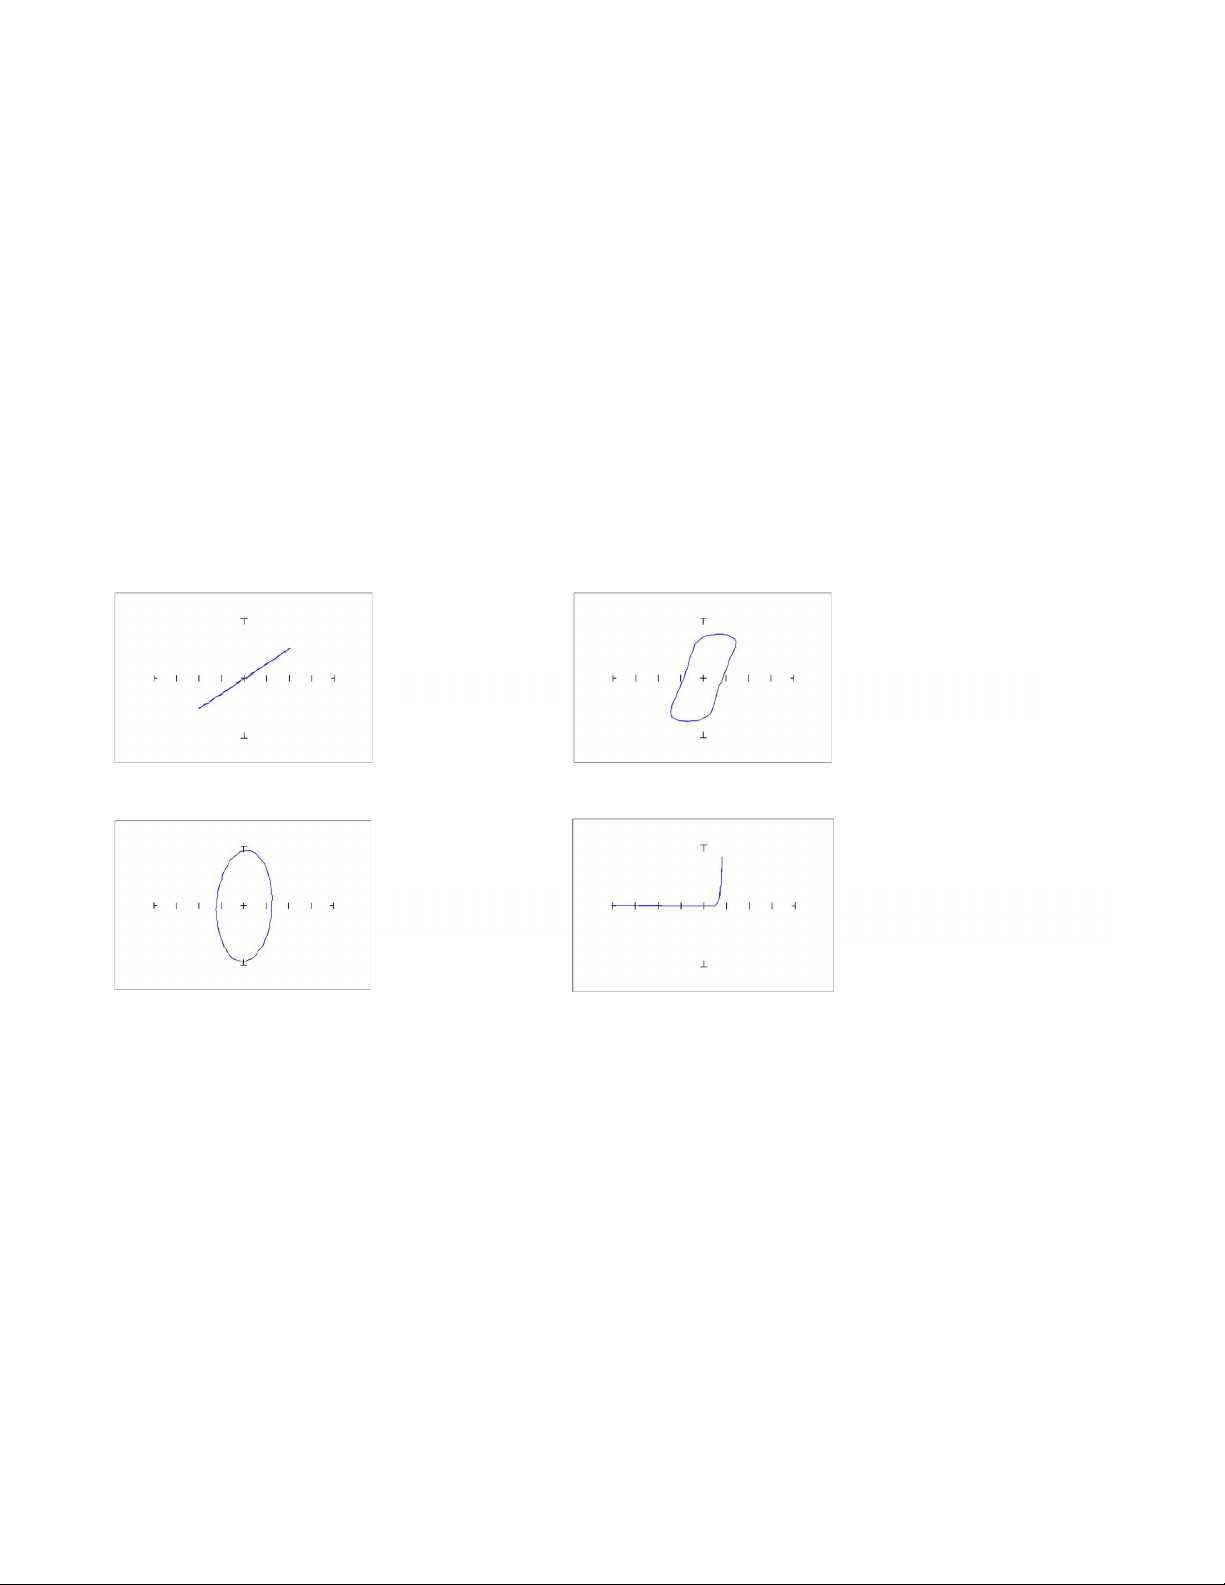
short circuit signature is a vertical line trace on the LCD display.
Connect the red microprobe to the output channel A jack on the Tracker 2800 and the black
microprobe to the Common jack. Touch and hold the probes together and observe the Tracker
signature on the LCD display.
You will see a vertical line trace in the middle of the LCD display.
Figure 2-10. LCD Display with Vertical Axis, Graticule Lines displaying a short circuit.
20
2-9 Four Basic Component Analog Signatures
All Tracker signatures are a composite of one or more of the four basic component signatures which
are: resistance, capacitance, inductance and semi-conductance. Refer to Fig 2-11. Each one of these
basic components responds differently to the Tracker 2800's test signal. Recognizing these four basic
unique signatures on the LCD display is one of the keys to successful ASA troubleshooting. When
components are connected together to form a circuit, the signature at each circuit node is a composite
of the basic component signatures in that circuit. For example, a circuit with both resistance and
capacitance will have a signature that combines the analog signatures of a resistor and capacitor. The
signature of a resistor is always indicated by a straight line at an angle from 0 to 90 degrees. The
signature of a capacitor is always in the form of a circle or ellipse shape. The signature of an inductor
is also a circle or ellipsoid shape that may also have internal resistance. Finally, the semiconductor
diode signature is always made up of two or more linear line segments that most of the time form an
approximate right angle. Semi-conductance signatures can show conduction in both forward and
reverse-bias. This will form a zener semiconductor pattern which will show both junctions.
Figure 2-11. Analog Signatures of the Four Basic Components
Resistance
Capacitance
Inductance
Semi-conductance