Tracker-2800-2800S.pdf - 第57页
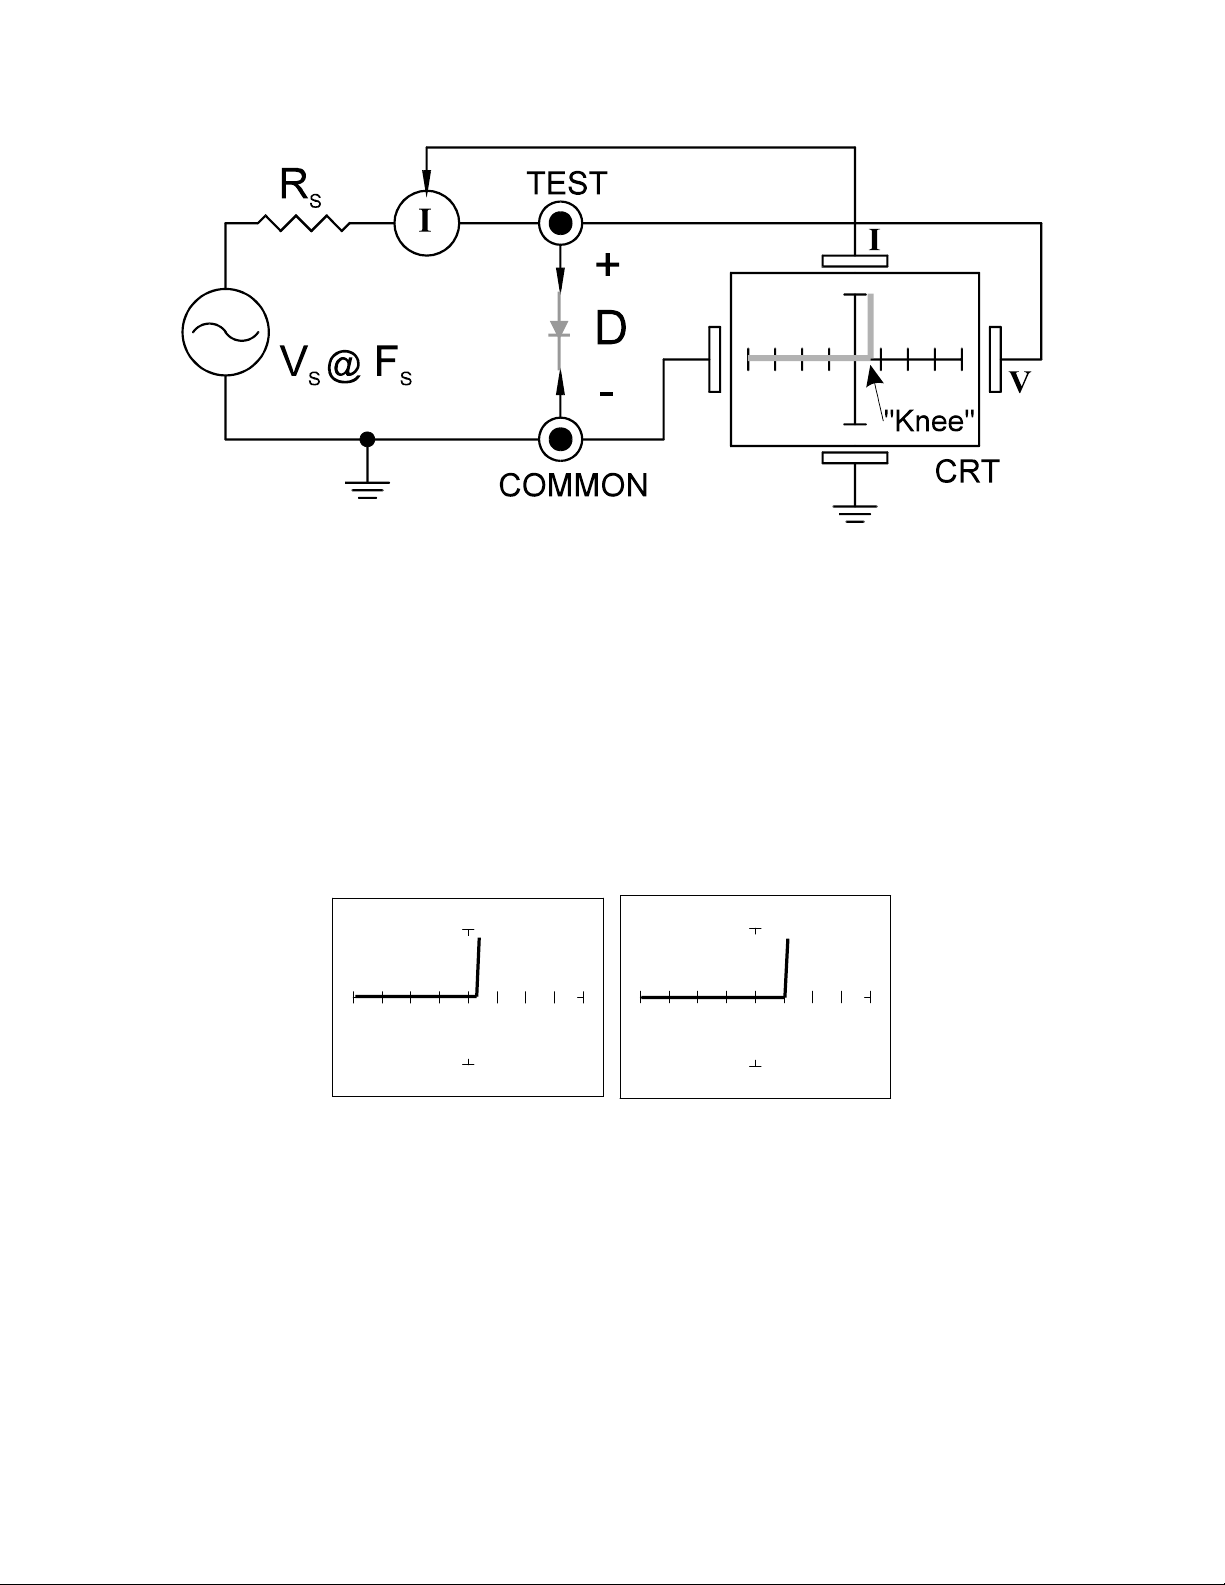
57 Figure 4-2 . Tracker 2800 Core C ircuit Block Diagram with a Diode. You can see this "knee" signature on some diodes in the nex t section. Do the following to display the analo g signature of a diode: 1. Sel…
56
SECTION 4 TESTING DISCRETE SEMICONDUCTORS
4-1. DIODES
The most basic type of solid state semiconductor component is the diode. Diodes are formed by
creating a junction between p-type and n-type semiconductor material. The pn junction gives diodes
and semiconductor components polarity characteristics that allow them to conduct current when an
external voltage is applied. They conduct current in one direction, but not in the other. Current flows in
a diode when the positive terminal (anode) is made more positive than the negative terminal (cathode).
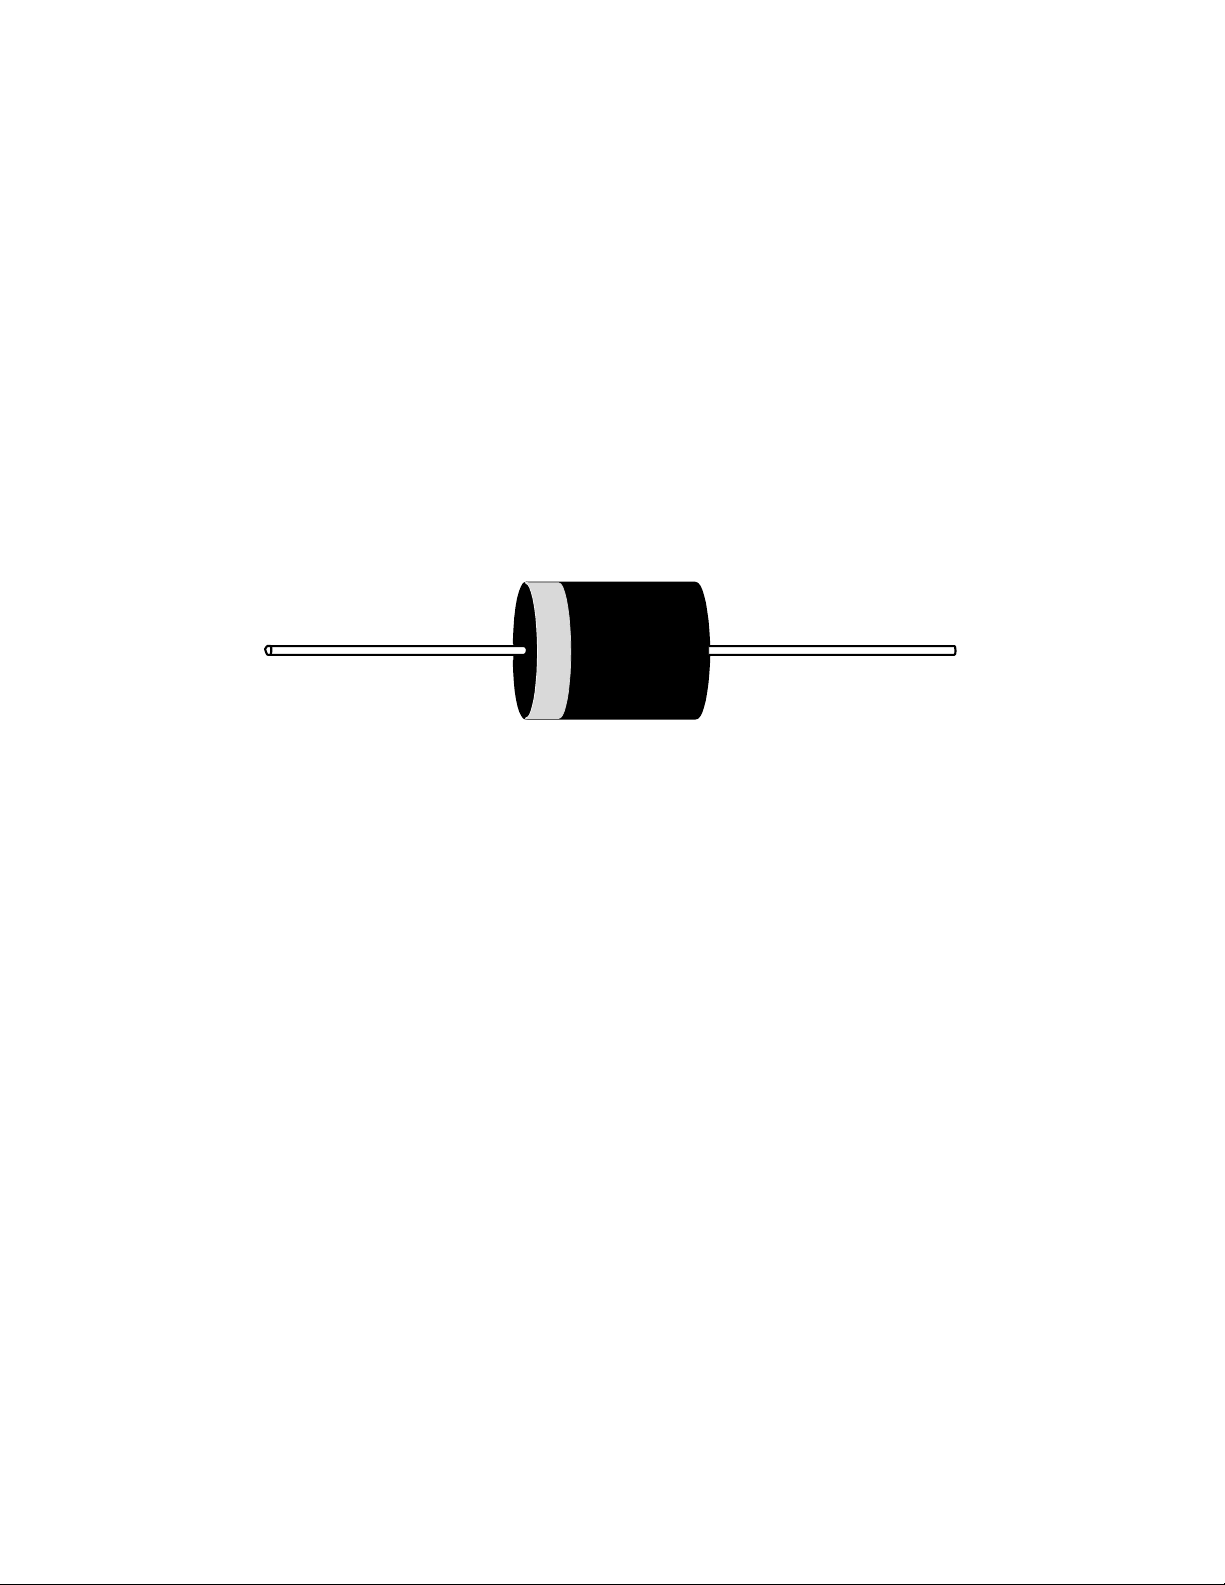
Figure 4-1 shows how the diode symbol indicates the polarity of the diode.
Figure 4-1. Diode and Schematic Symbol.
Diode Signatures
Diode signatures demonstrate the fundamental operation of a semiconductor junction. There is a
threshold or forward voltage V
F
(about 0.6V for a silicon diode) at which the diode begins to conduct
current. The diode acts as an open circuit and no current flows as long as the voltage differential
between the anode and cathode is below that threshold. As the anode to cathode voltage becomes more
positive, the diode will begin to conduct current. Once current begins to flow in the diode, very small
increases in anode voltage will cause very large increases in current. In analog signature analysis, this
is called the “knee” effect in which is characteristic of a good semiconductor junction.
57
Figure 4-2. Tracker 2800 Core Circuit Block Diagram with a Diode.
You can see this "knee" signature on some diodes in the next section.
Do the following to display the analog signature of a diode:
1. Select 50, 10V and 60Hz.
2. Place or clip the red test lead from the Tracker 2800's Channel A jack to anode lead of the diode.
3. Place or clip the black test lead from the Tracker 2800's Common jack to anode lead of the diode.
V
S
= 10 Volts V
S
= 3 Volts
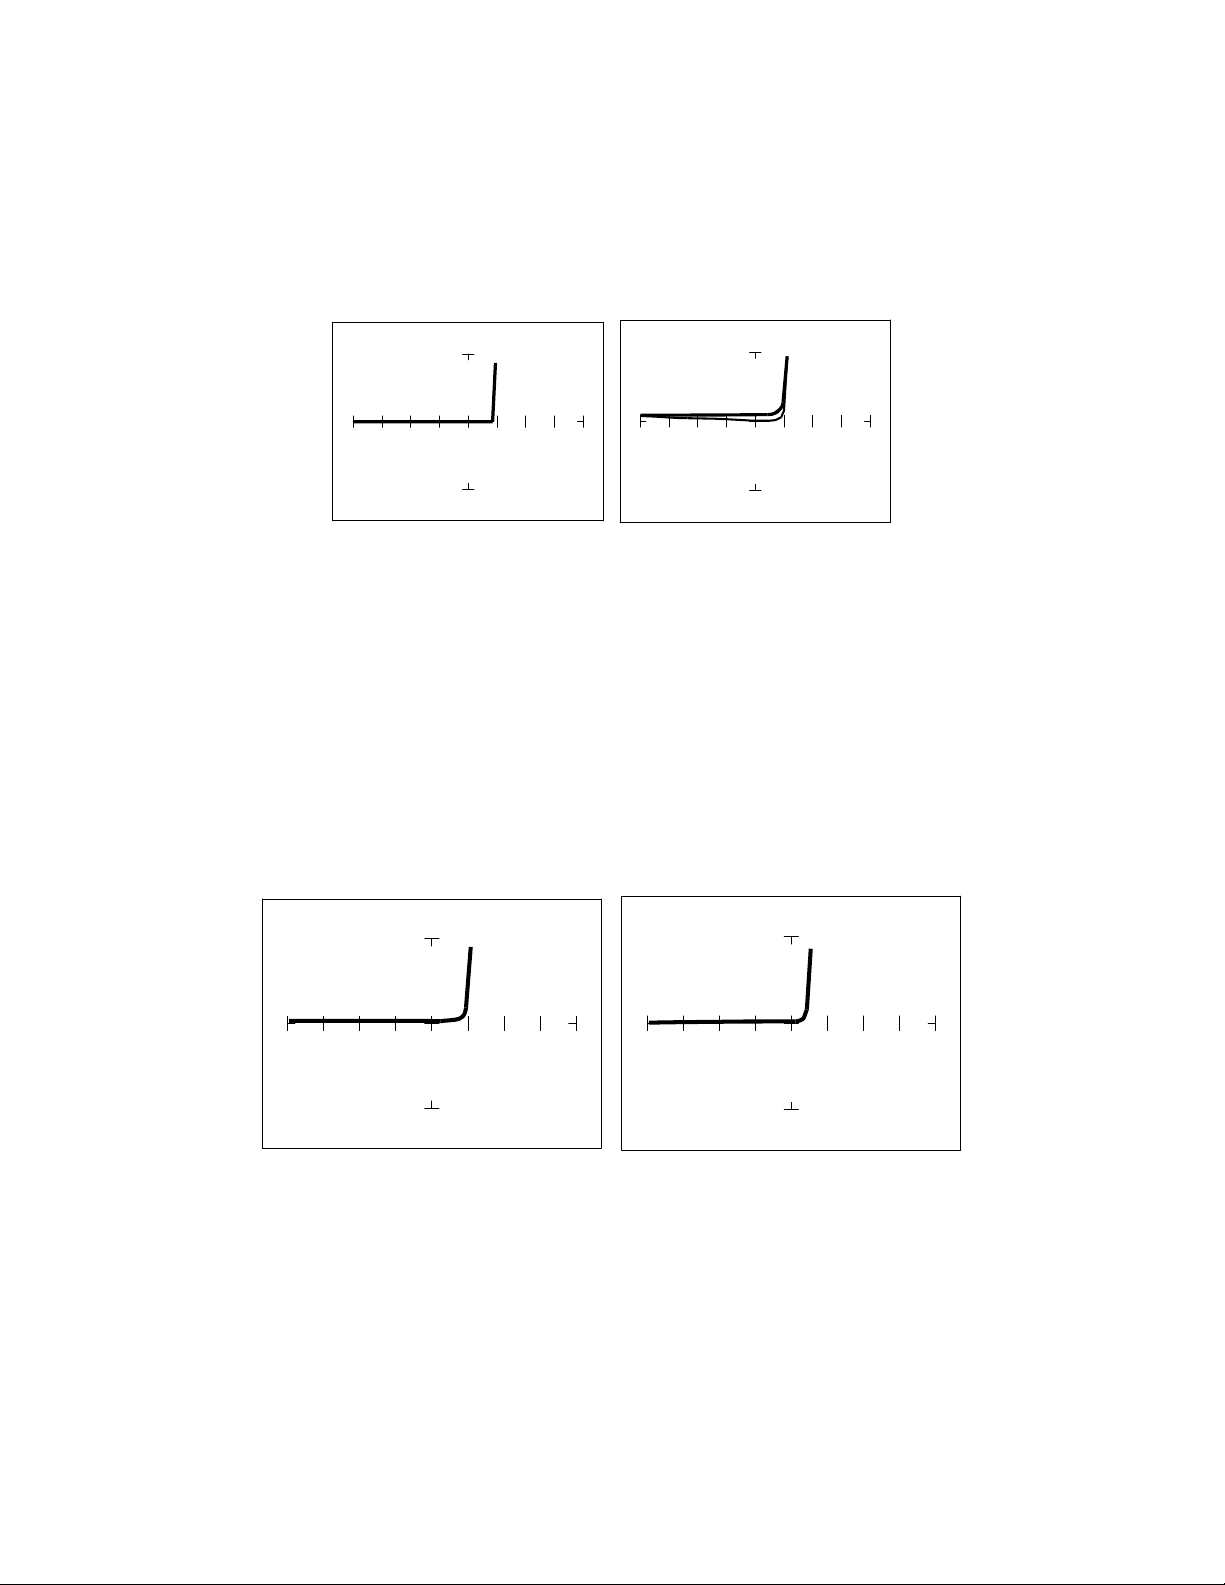
Figure 4-3. Signatures of a 1N914 type Silicon Diode at 50 and 60Hz.
The diode signatures are similar to each other. In the 50 Ohm range, the test signal voltage is 10 V
P
.
Each horizontal division on the display equals approximately 2.5 V. In this range the diode's signature
shows that its threshold or forward voltage is approximately 0.6 Volts. By lowering the test voltage to
3 V with the encoder, the 0.6 volt threshold is clearly visible for easier analysis.
58
Effects of Changing Frequency on Diode Signatures
With the 3V, 50 selected and the test signal frequency of 60 Hz, the signature of the diode is shown
on the left figure below. Changing only the test signal frequency to 2kHz displays the signature on the
right. At F
S
= 2kHz, the diode's signature has slight circular loop added to it. This loop in the signature
is due to a physical characteristic of diodes called junction capacitance.
60Hz 2KHz
Figure 4-4. Signature of a 1N914 Diode at Different Frequencies at 3V and 50.
Effects of Changing Resistance on Diode Signatures
Changing Tracker 2800's internal resistance R
S
moves the vertical knee portion of the diode's analog
signature. As R
S
increases, the knee of the signature moves inward toward the origin. R
S
controls the
current that's flowing through the diode so the forward diode voltage changes in response to the current
change.
R
S
= 50 R
S
= 100K
Figure 4-5. Signature of a 1N914 Diode at Different Resistances at 3V and 60Hz