Tracker-2800-2800S.pdf - 第42页
42 The device to be tested must have all power turn ed off and have all high voltage capacitors discharged before connecting the Tracker 2800 to the device. Do the following to display the analo g signature of a capacito…
41
3-2. CAPACITORS
With a capacitor connected to the Tracker 2800, the test signal across it responds quite differently than
a resistor. The typical analog signature of a capacitor is an elliptical or circular pattern due to the fact
that relationship between the test signal's current and voltage are non-linear. The current's waveform is
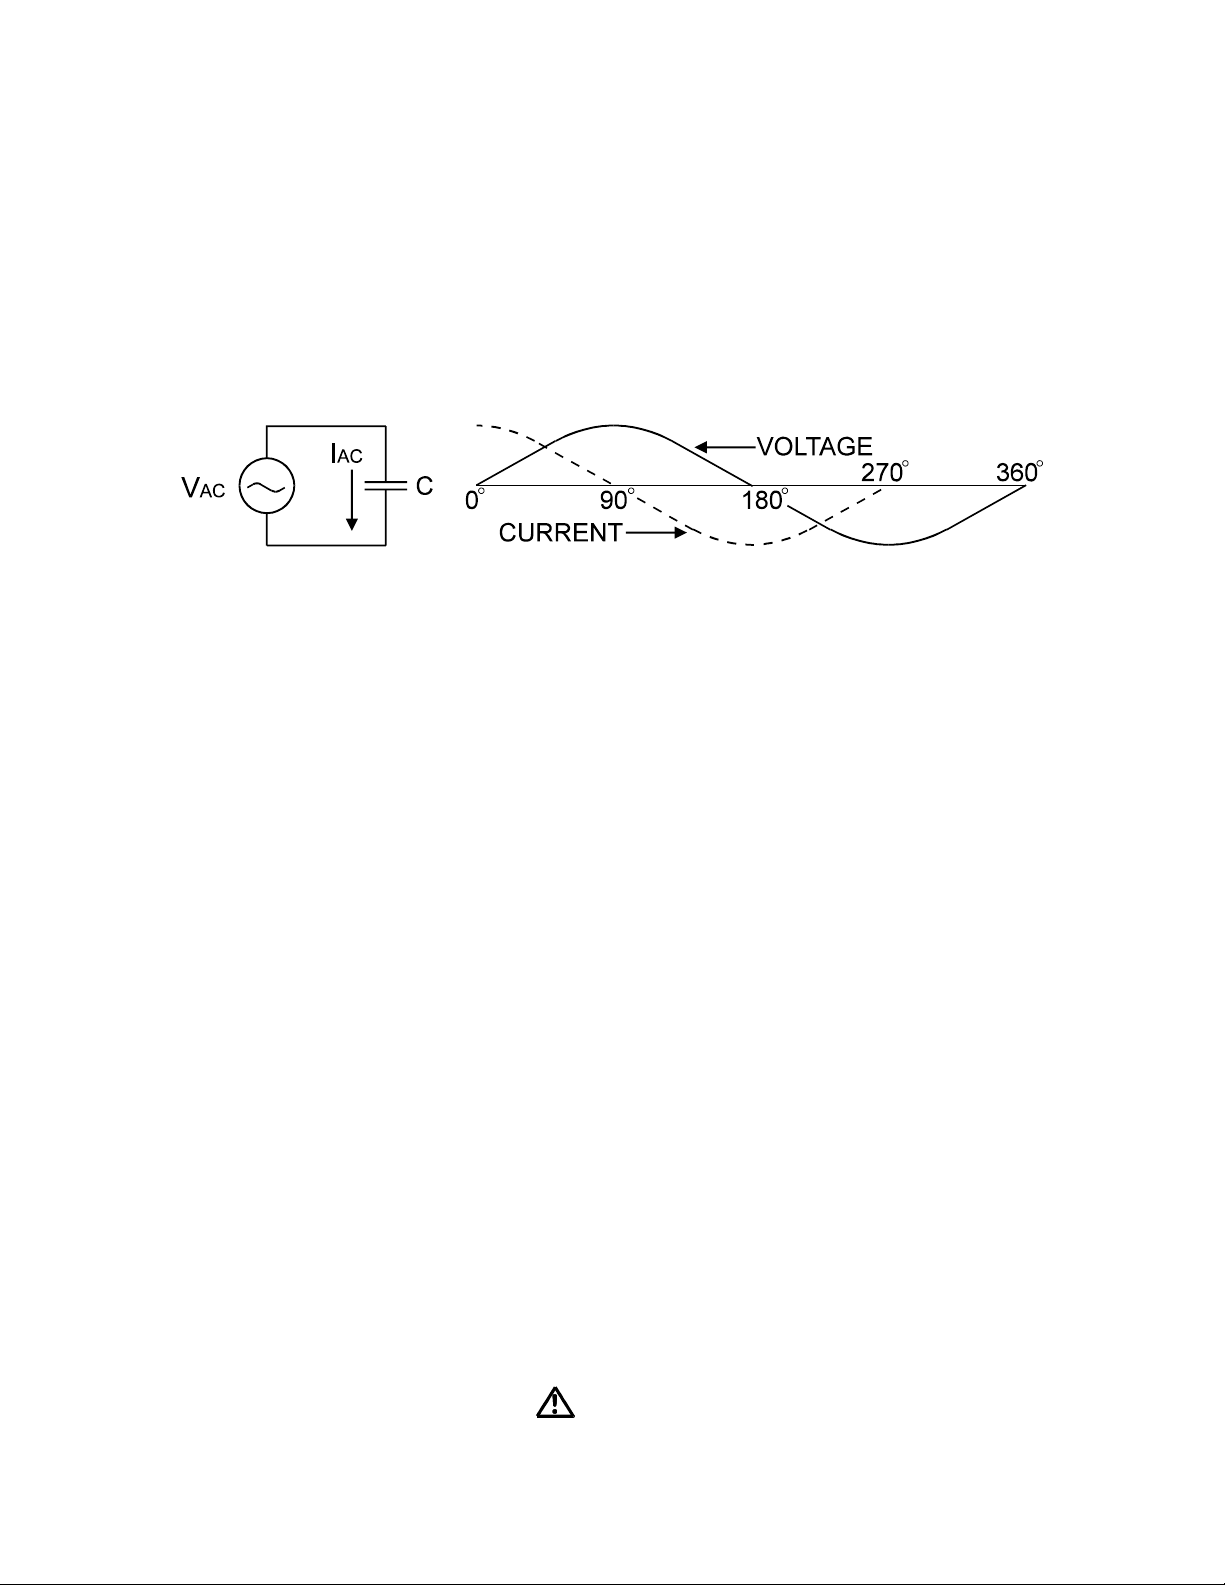
90 degrees out of phase with respect to the voltage. The diagram below illustrates this basic principle
for capacitors.
Figure 3-7. Capacitor Circuit with Test Signal's Current and Voltage Waveforms.
As the test signal's voltage crosses zero volts and becomes more positive, the current flowing in the
circuit is at its maximum and becoming smaller. By the time the voltage has reached its maximum
value, the current in the circuit has ceased flowing. As the voltage begins decreasing toward zero, the
current begins increasing toward maximum. When the voltage reaches zero, the current is at its
maximum value. Similarly, this same pattern follows as the voltage goes negative.
Because the current is at its maximum value when the voltage is at zero, the current leads the voltage.
This is called phase shift and in a purely capacitive circuit, this phase shift equals 90. On the Tracker
2800, this analog signature appears as a circular waveform. The actual shape and slope of the elliptical
signature depends on the capacitance and impedance value of the component and the test signal's
voltage
,
internal resistance and frequency
.
Capacitor Analog Signatures
The goal of this part is to explore some capacitive signatures and to help you understand how capacitor
signatures are related to:
The capacitance (µf) of the circuit under test
The frequency (F
s
) of the test signal
The voltage (V
s
) of the test signal
The internal resistance (R
s
) of the Tracker 2800
Plug the red test microprobe in the Channel A jack, and the black test clip lead in the Common jack.
CAUTION
42
The device to be tested must have all power turned off and have all high voltage capacitors
discharged before connecting the Tracker 2800 to the device.
Do the following to display the analog signature of a capacitor:
1. Select the 10V, 50 and 60Hz range
2. Place or clip a test lead on the opposite ends of a capacitor and observe the signature.
The Signatures of Different Capacitors
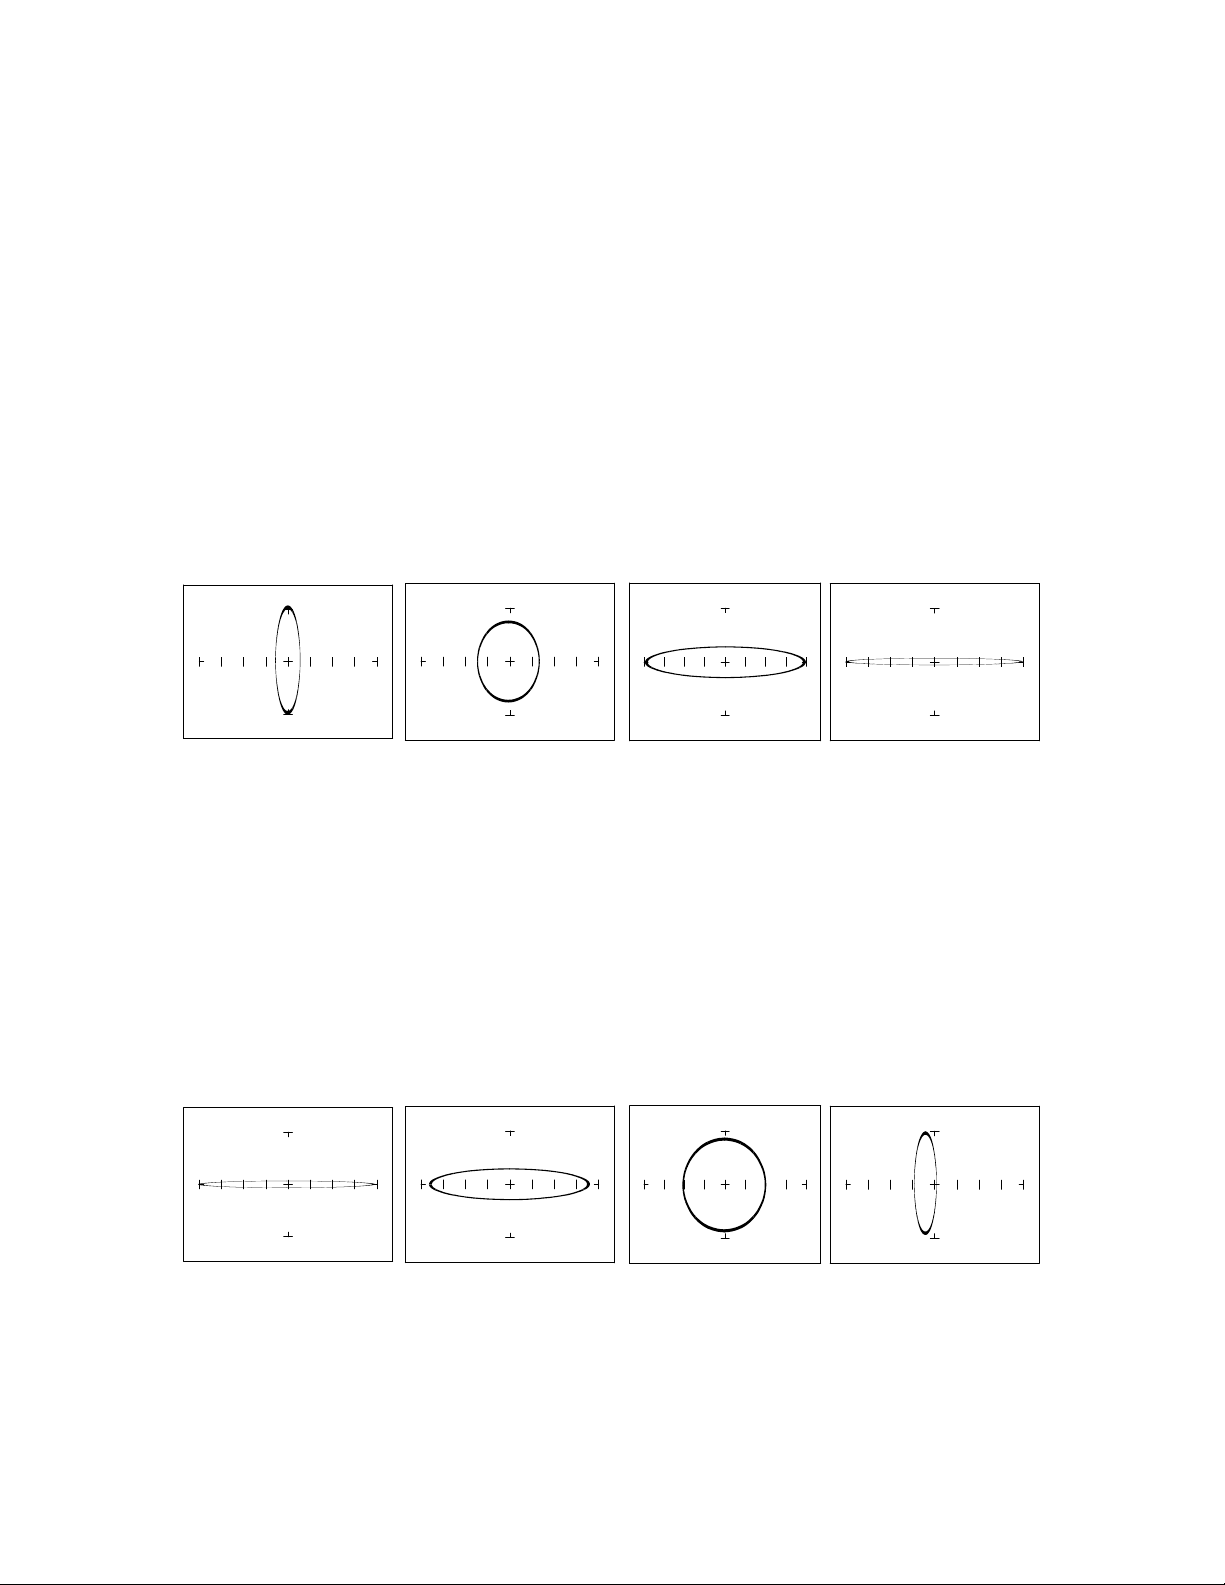
The figure below shows analog signatures for four different value capacitors, 1000 f, 100 f, 10 f
and 1f. Select 10V, 50 and 60Hz.
1000 µF 100 µF 10 µF 1 µF
Figure 3-8. Signatures of 4 Capacitors in the 10V, 50 and 60Hz Range.
Note that as the capacitance values decrease, each signature changes from a vertical elliptical pattern to
a horizontal elliptical pattern. In ASA, a large value capacitor has a signature that looks similar to a
short circuit. And likewise, a small value capacitor has a signature that's similar to an open circuit.
Effect of Changing Frequency on a 10F Capacitor
Select 10V, 50 and 20Hz. Then select 60Hz, 500Hz and 2KHz.
F
S
= 20Hz F
S
= 60Hz F
S
= 500Hz F
S
= 2KHz
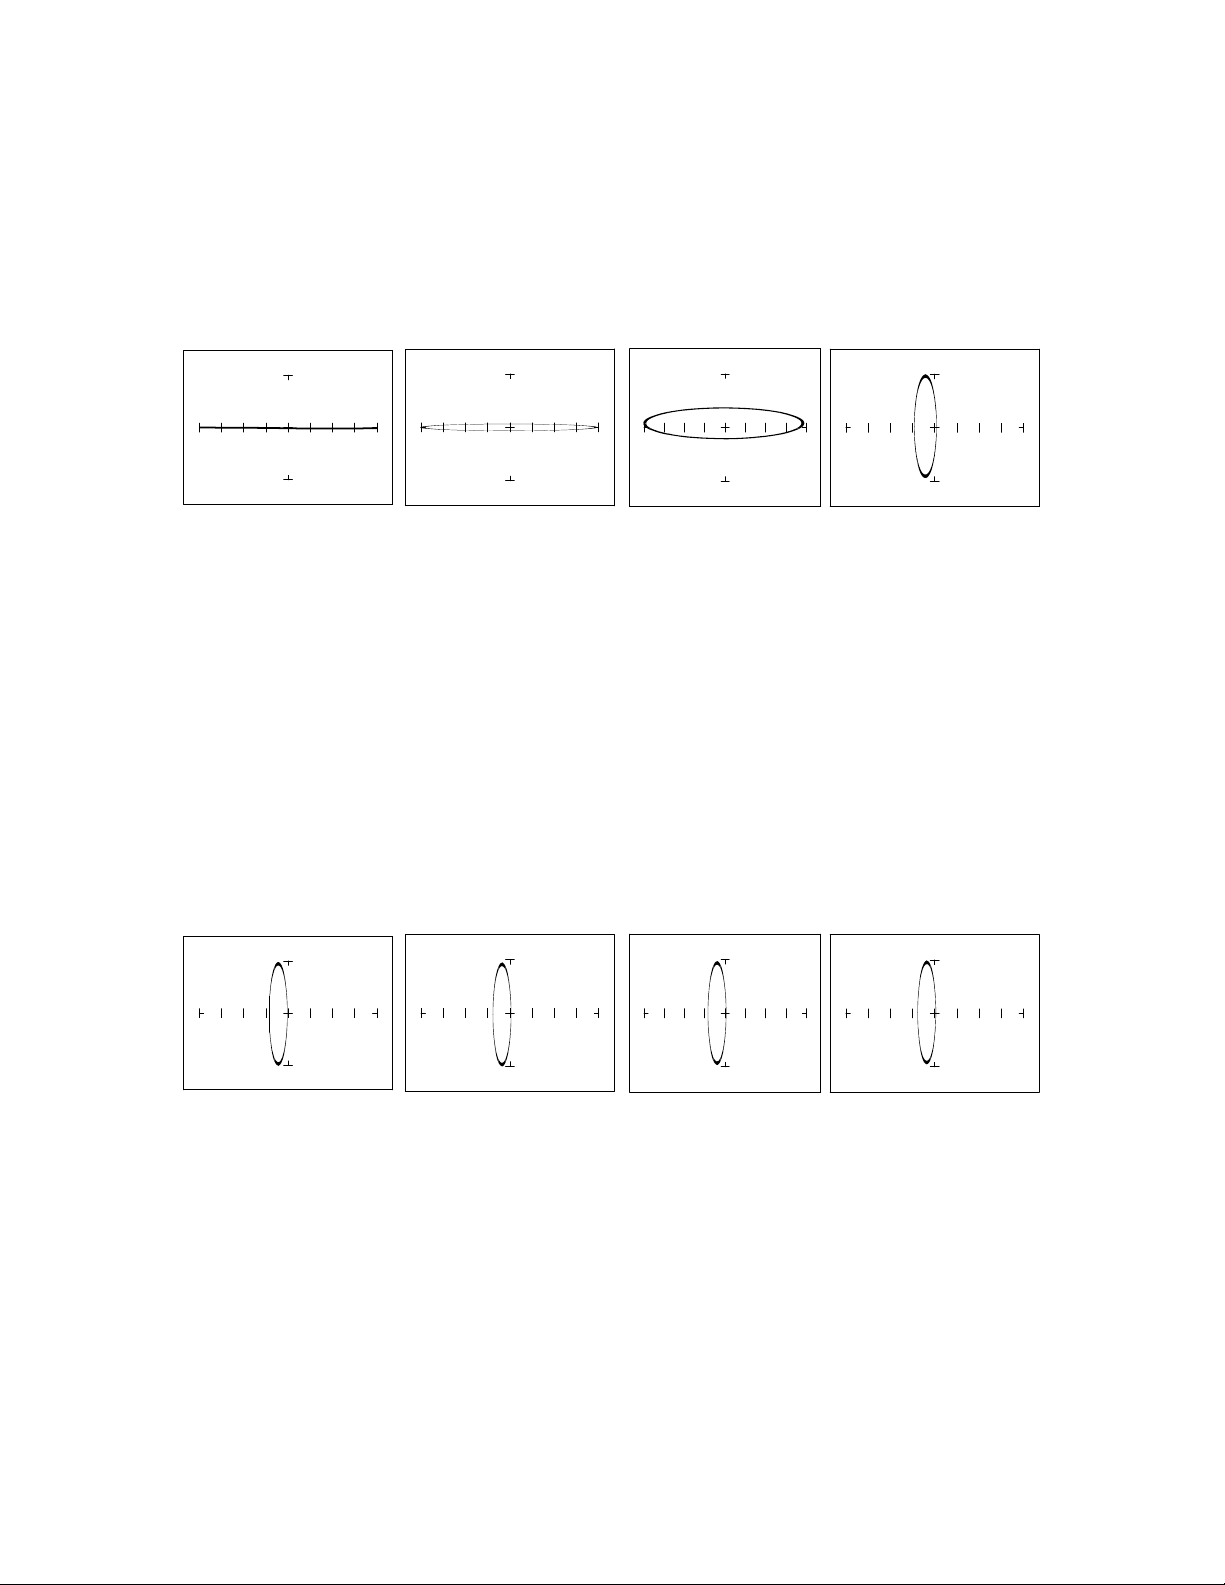
Figure 3-9. Signatures of a 10F Capacitor at Different Frequencies
Note that as the test signal frequency increases, the 10 F capacitor's signature changes from a
horizontal elliptical pattern to a vertical elliptical pattern. In ASA, a capacitor at a low test frequency
43
has a signature that looks similar to an open circuit. And likewise, the same capacitor at a high
frequency has a signature that's similar to a short circuit.
Effect of Changing Frequency on a 0.1F Capacitor
Select 10V, 1K and 20Hz. Then select 60Hz, 500Hz and 2KHz.
F
S
= 20 Hz F
S
= 60 Hz F
S
= 500 Hz F
S
= 2 kHz
Figure 3-10. Signatures of a 0.1 F Capacitor at Different Frequencies.
Note that as the test signal frequency increases, each signature changes from a horizontal elliptical
pattern to a vertical elliptical pattern. In ASA, a small value capacitor at a low test frequency has a
signature that looks similar to a short circuit. And likewise, a small value capacitor at a high test
frequency has a signature that's similar to an open circuit. The signature of the 0.1 F capacitor is
similar to the 10 F capacitor in shape but not in size due to the differences in their value.
Effect of Changing Voltage on a 1F Capacitor
Select 200mV, 20K and 60Hz. Then select 5V, 15V and 20V.
V
S
= 200mV V
S
= 5V V
S
= 15V V
S
= 20V
Figure 3-11. Signatures of a 1 F Capacitor at Different Test Signal Voltages.
As V
S,
the test signal voltage increases from low to high, the signatures did not change.