Tracker-2800-2800S.pdf - 第58页
58 Effects of Changing Frequency on Diode Signatures With the 3V, 50 selected and the test signal frequenc y of 60 Hz, the signature of the diode is shown on the left figure below. Ch anging only the test signal freque…
57
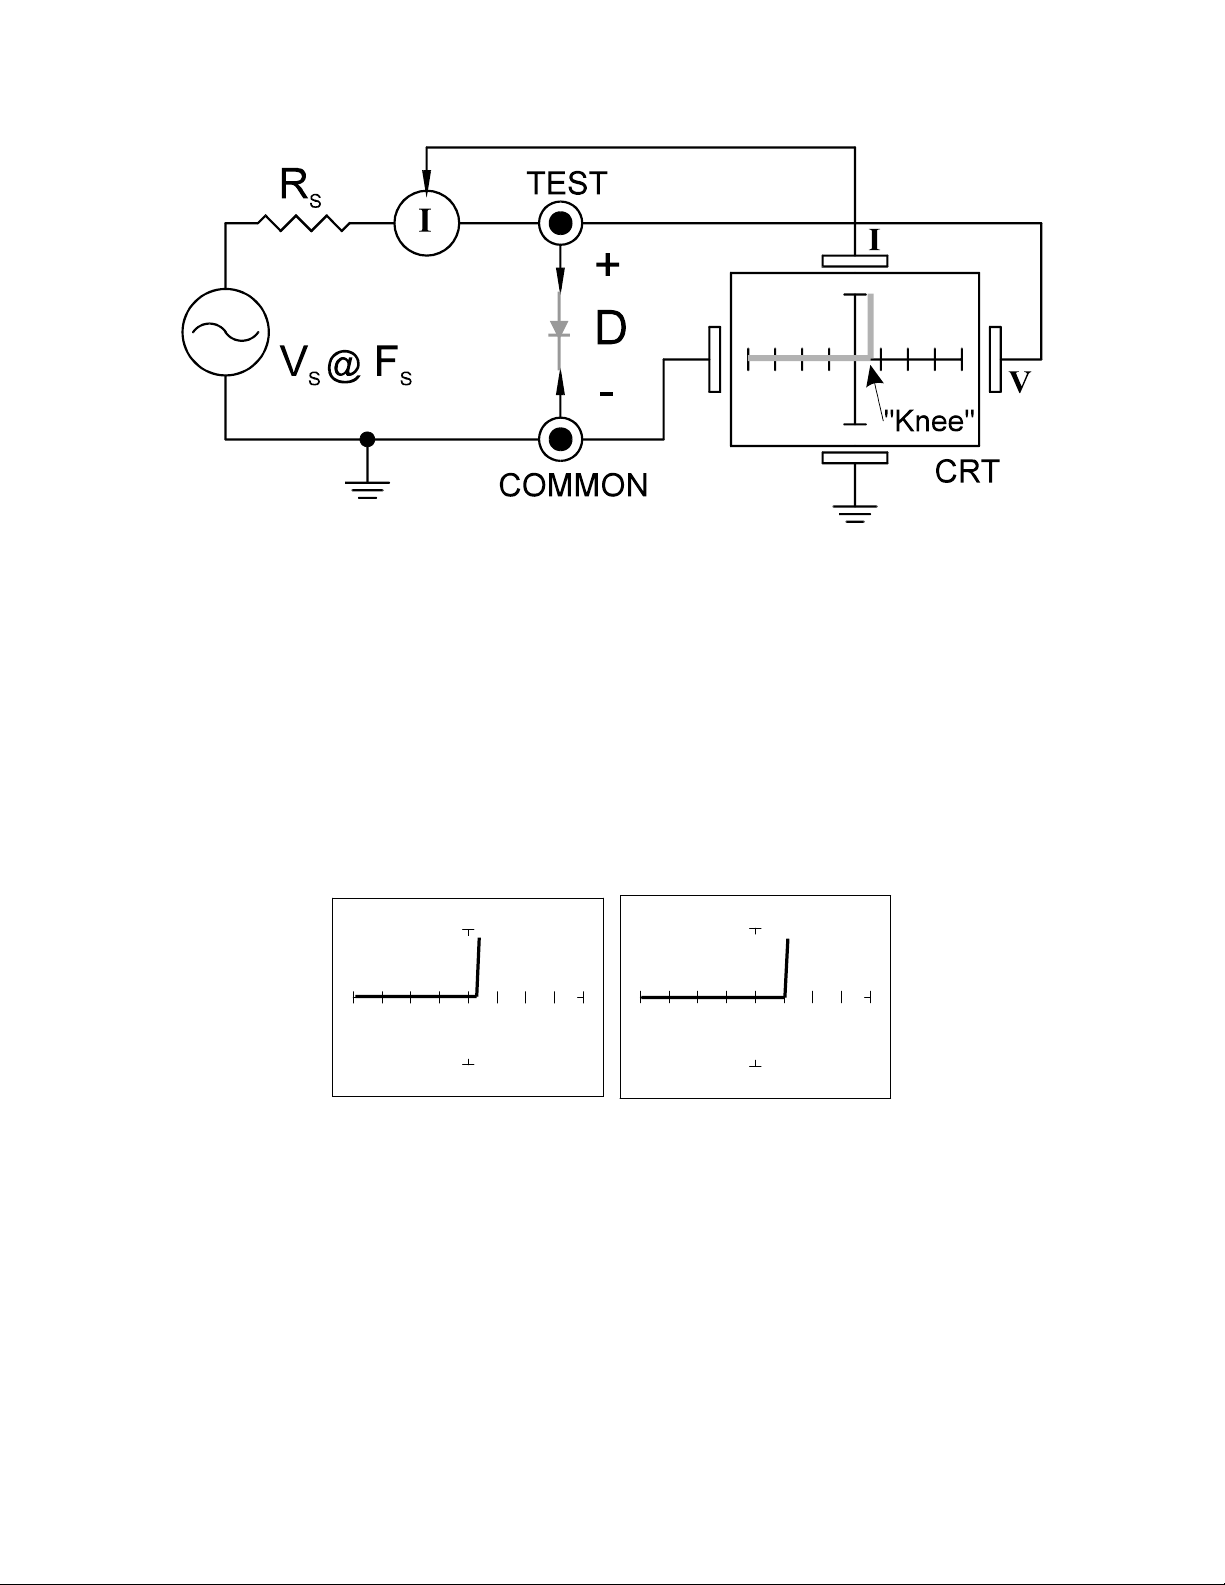
Figure 4-2. Tracker 2800 Core Circuit Block Diagram with a Diode.
You can see this "knee" signature on some diodes in the next section.
Do the following to display the analog signature of a diode:
1. Select 50, 10V and 60Hz.
2. Place or clip the red test lead from the Tracker 2800's Channel A jack to anode lead of the diode.
3. Place or clip the black test lead from the Tracker 2800's Common jack to anode lead of the diode.
V
S
= 10 Volts V
S
= 3 Volts
Figure 4-3. Signatures of a 1N914 type Silicon Diode at 50 and 60Hz.
The diode signatures are similar to each other. In the 50 Ohm range, the test signal voltage is 10 V
P
.
Each horizontal division on the display equals approximately 2.5 V. In this range the diode's signature
shows that its threshold or forward voltage is approximately 0.6 Volts. By lowering the test voltage to
3 V with the encoder, the 0.6 volt threshold is clearly visible for easier analysis.
58
Effects of Changing Frequency on Diode Signatures
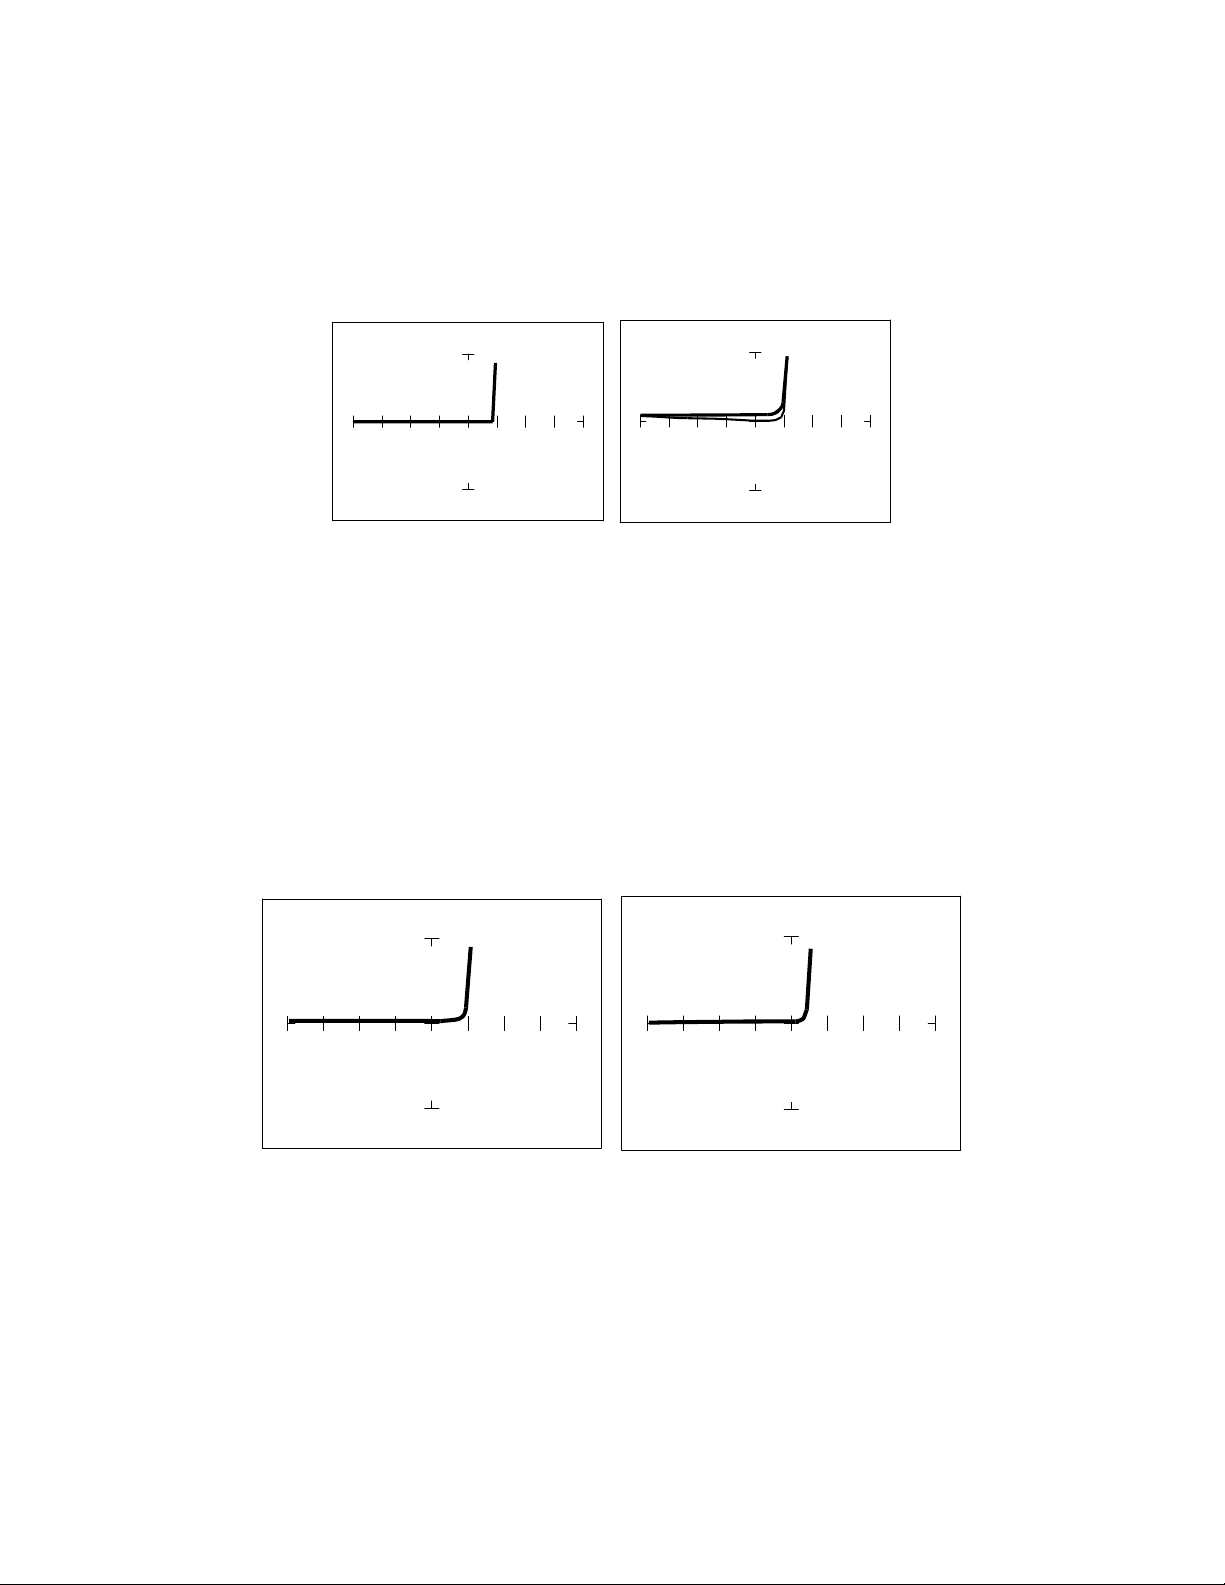
With the 3V, 50 selected and the test signal frequency of 60 Hz, the signature of the diode is shown
on the left figure below. Changing only the test signal frequency to 2kHz displays the signature on the
right. At F
S
= 2kHz, the diode's signature has slight circular loop added to it. This loop in the signature
is due to a physical characteristic of diodes called junction capacitance.
60Hz 2KHz
Figure 4-4. Signature of a 1N914 Diode at Different Frequencies at 3V and 50.
Effects of Changing Resistance on Diode Signatures
Changing Tracker 2800's internal resistance R
S
moves the vertical knee portion of the diode's analog
signature. As R
S
increases, the knee of the signature moves inward toward the origin. R
S
controls the
current that's flowing through the diode so the forward diode voltage changes in response to the current
change.
R
S
= 50 R
S
= 100K
Figure 4-5. Signature of a 1N914 Diode at Different Resistances at 3V and 60Hz
59
Composite Diode Signatures
A composite analog signature is a combination of several components connected together in an
electronic circuit. Up to this point, we have been showing you what the basic component signatures
look like out of circuit. In the real world of electronics troubleshooting, components are connected
together in a circuit and when testing with ASA, the signatures are a composite that may appear quite
complex. However, with knowledge of ASA fundamentals and experience you will find that even the
most complex looking signatures can be analyzed quickly and efficiently.
This section will introduce you to some examples of composite diode signatures.
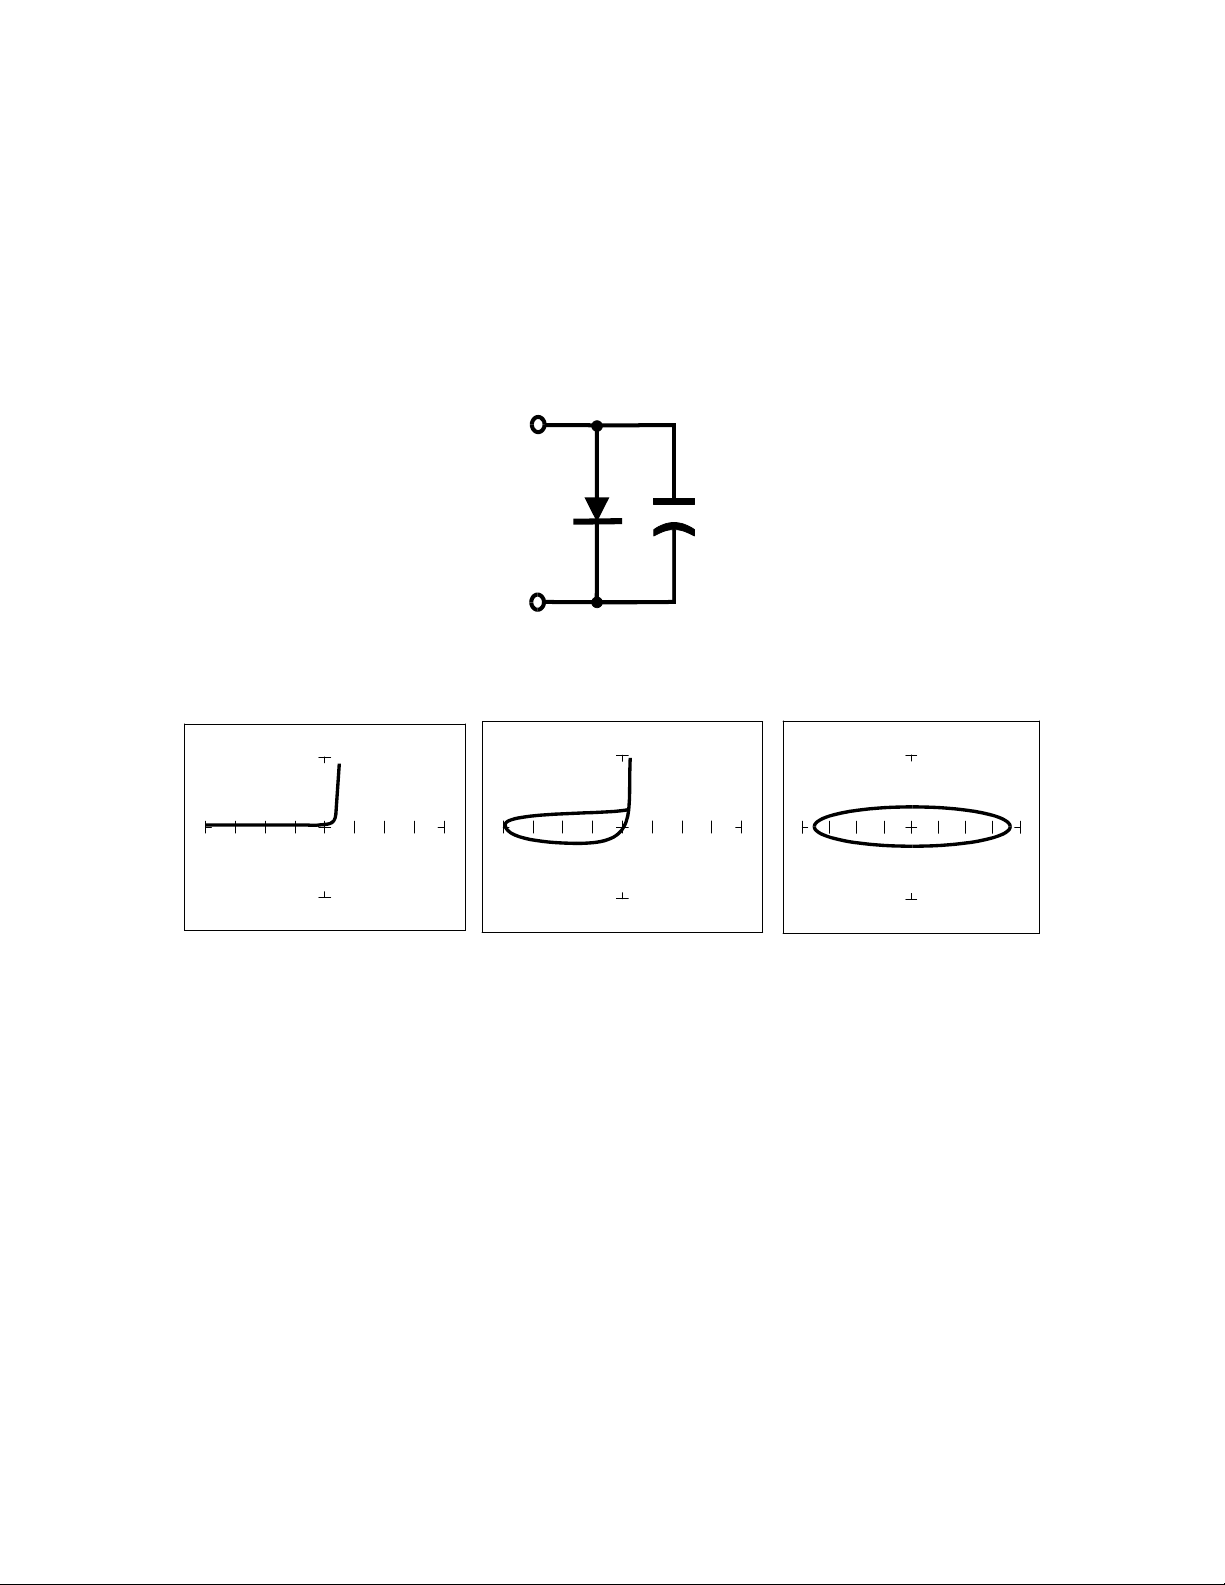
Figure 4-7. Composite Model of a Diode and Capacitor in Parallel.
V
S
= 10 V, F
S
= 20 Hz V
S
= 10 V, F
S
= 1KHz V
S
=200 mV, F
S
= 1KHz
Figure 4-8. Composite Signature - 1N914 Diode and 1F Capacitor in Parallel.
The signature on the left shows only the diode signature because the test signal frequency is set below
any visible contribution due the capacitive reactance. The composite signature in the center consists of
the distinctive loop of the capacitor and the "knee" pattern of the diode. The signature on the right
shows only the capacitor signature because the test signal voltage is below the diode's turn on level.
When multiple components are connected together, it's important to realize that the Tracker 2800 has
the ability to selectively display the signature of a single component.