Tracker-2800-2800S.pdf - 第17页
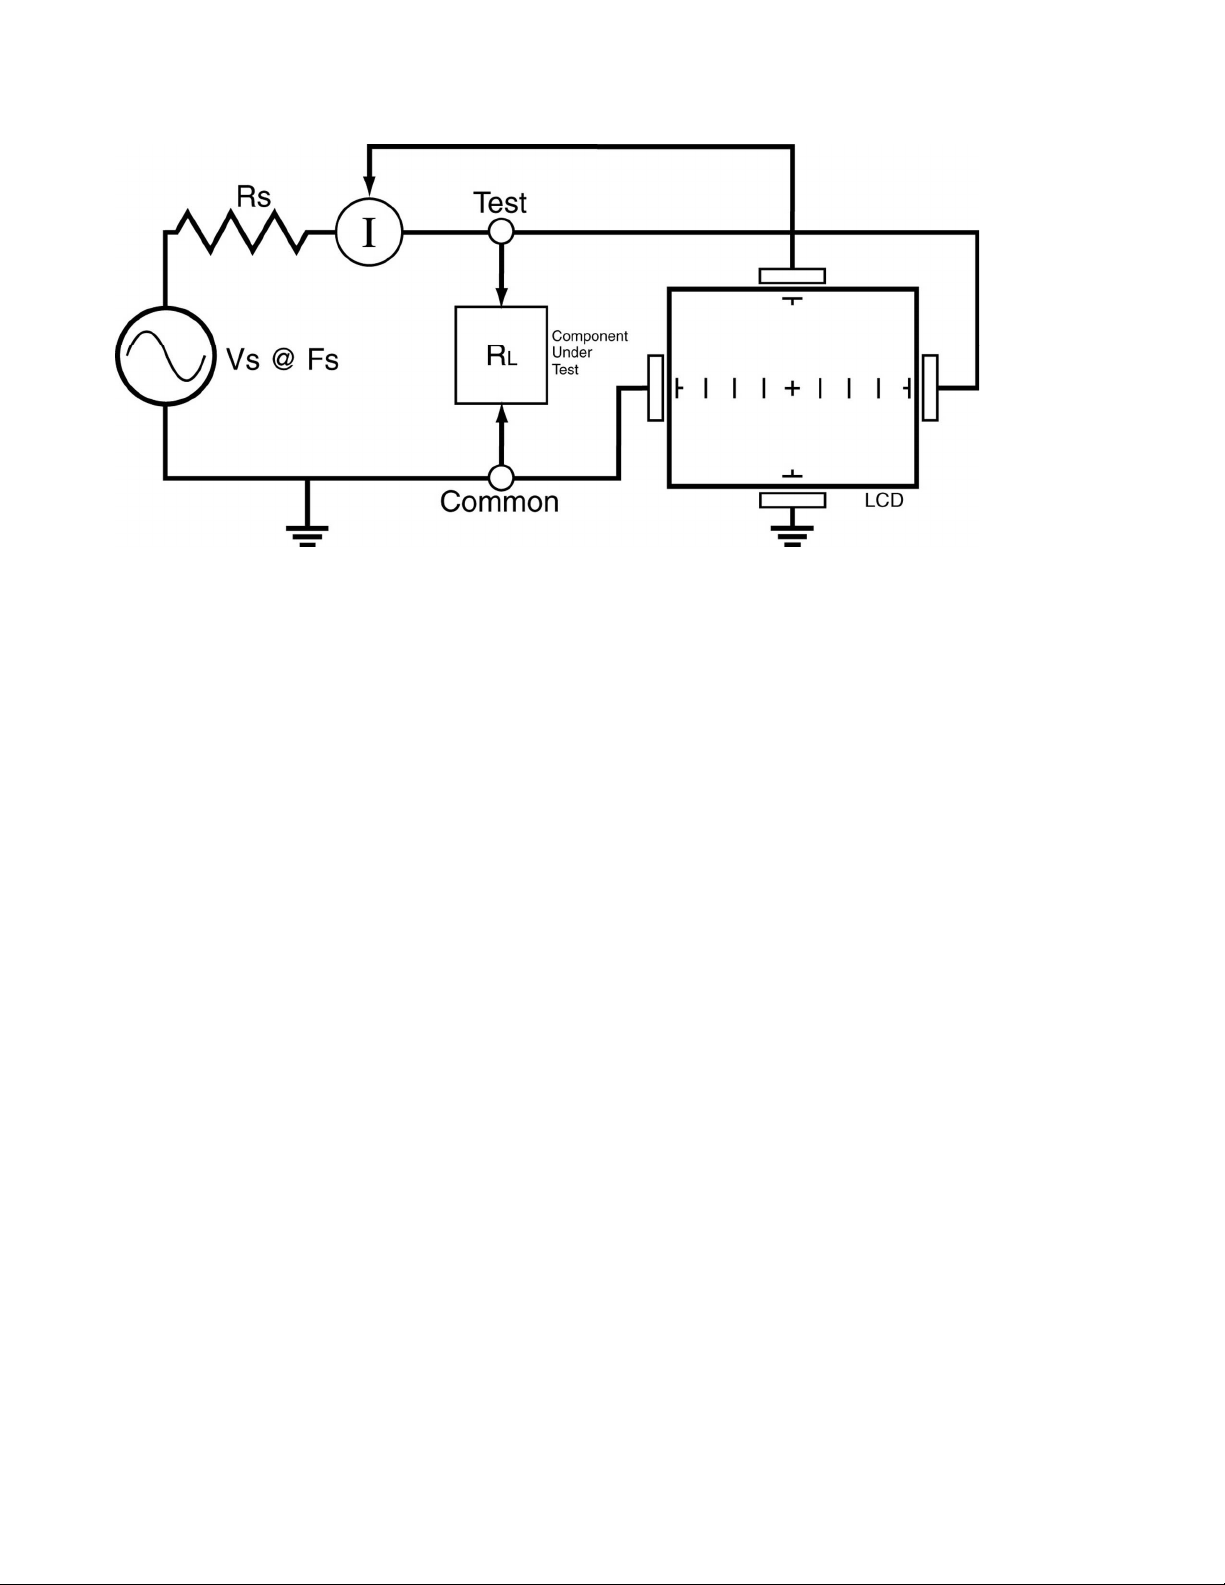
17 Figure 2-7: Tracker 280 0 Core Circuit Block Diagram R s = Source Resistance, V s = Source Voltage, R L = Load R esistance, F s = Source Frequenc y Each test signal or ran ge has three parameters: source volta ge V s …

16
2-6 Frequency Selection
Six test signal frequencies (20Hz, 50Hz, 60Hz, 200Hz, 500Hz and 2kHz) can be selected by pressing
the appropriate button on the front panel. Each button has a dual function. For example, pressing the
20Hz button (steady LED indication) selects 20Hz as the test signal frequency. Pressing it again
(blinking LED indication) selects 50Hz as the test signal frequency. Frequency is primarily used to
enhance the signatures of reactive components such as capacitors and inductors.
2-7 Voltage Selection
The voltage selector buttons (200mV/3V, 5V/10V and 15V/20V) allow the user to select the peak
applied sine-wave voltage. Each button has a dual function. For example, pressing the 5V button
(steady LED indication) selects 5 Volts as the test signal’s peak value. Pressing it again (blinking LED
indication) selects 10 Volts as the test signal peak value.
Selection of the voltage value is generally based on the signature shape of tested semiconductors and
the internal operating voltage of a device. It is best to start with a lower voltage of 3V or 5V.
2-8 Analog Signature Analysis (ASA) Basics
Here's how ASA and power-off testing works:
The Tracker 2800 outputs a precision current-limited AC sine wave signal to a component and displays
the resulting current flow, voltage drop and any phase shift on the internal LCD’s display. The current
flow causes a vertical trace deflection on the display, while the voltage across the component causes a
horizontal trace deflection. This resultant trace on the display is called an analog signature.
Understanding the Tracker 2800's basic core circuit is the key to understanding how analog signatures
respond to different types of components. Since the induced current is a function of the impedance of
the circuit, the analog signature displayed can be thought of as a visual representation of Ohm’s Law,
V = IR where V = voltage, I = current and R = resistance
The next figure shows a simplified diagram of the Tracker’s core circuit. The sine wave generator is
the test signal source and is connected to a resistor voltage divider made up of R
s
and R
L
. The load
impedance, R
L
, is the impedance of the component under test. R
L
is in series with the Tracker 2800's
internal or source impedance R
s
. Because R
s
is constant, both the voltage across the component under
test and the current through it is a sole function of R
L
.
17
Figure 2-7: Tracker 2800 Core Circuit Block Diagram
R
s
= Source Resistance, V
s
= Source Voltage, R
L
= Load Resistance, F
s
= Source Frequency
Each test signal or range has three parameters: source voltage V
s
, resistance R
s
and source frequency
F
s
. When using ASA for troubleshooting, the objective is to select the range that will display the most
descriptive Tracker signature information. The Tracker 2800 can readily accomplish this by changing
the proper range parameter. The source voltage V
s
of the test signal can be used to enhance or
disregard semiconductor switching and avalanche characteristics. The F
s
or frequency of the test signal
source can be used to enhance or disregard the reactive factor (capacitance or inductance) of a
component or circuit node.
Horizontal Axis
The voltage across the component under test controls the amount of horizontal trace deflection on the
LCD display. When the component under test is removed, creating an open circuit (e.g., R
L
= ), the
voltage at the output terminals is at its maximum and thus the trace on the display is a straight
horizontal line with its maximum width.
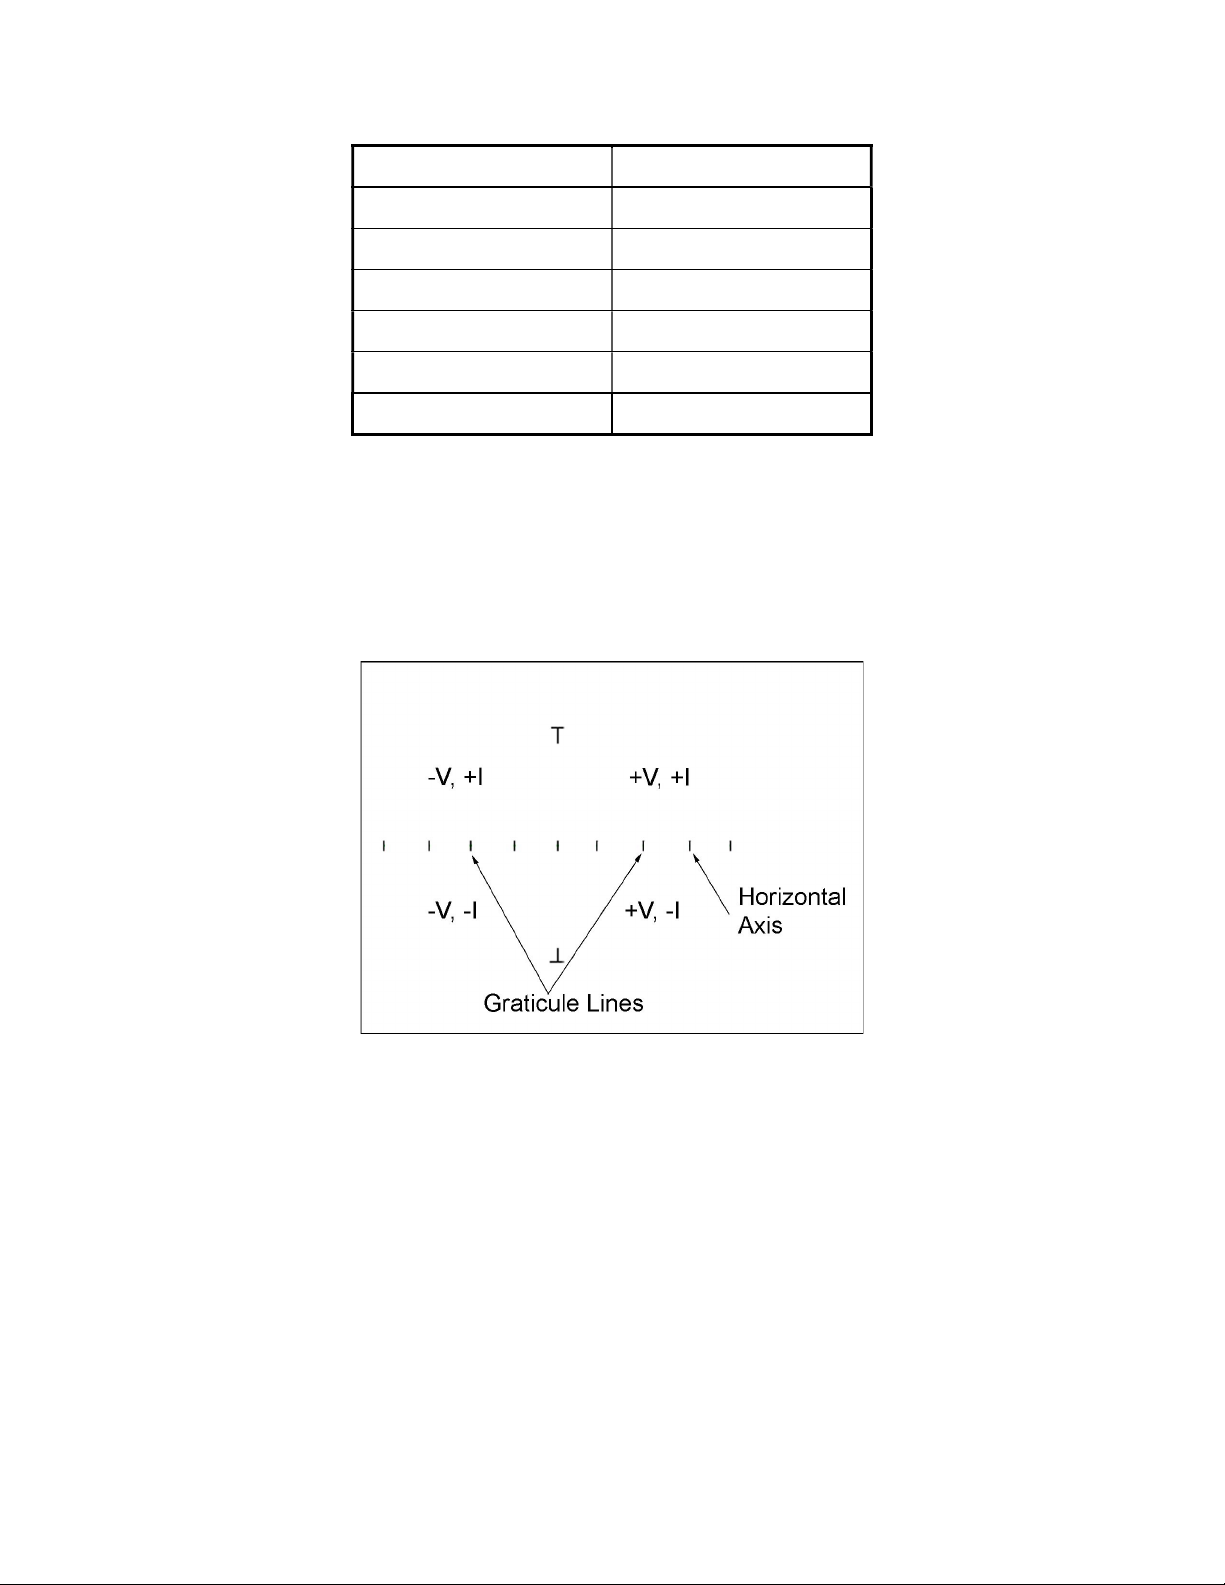
The horizontal axis is divided up by small graticule lines similar to those on a conventional
oscilloscope CRT. Each mark is approximately 1/4 of the peak range voltage. For example, in the 10 V
range, each division is approximately 2.5 V. You can use these graticule marks to get a rough estimate
of the voltage drop across the component under test. Changing the V
s
of the test range effectively acts
the same as changing the Volts-per-division on an oscilloscope. Table 2-3 shows the volts per division
for each Tracker voltage range.
18
Range Volts/Div
20V 5.00
15 V 3.75
10 V 2.50
5 V 1.25
3 V 0.75
200 mV 0.05
Table 2-3 Tracker 2800 Horizontal Sensitivities
The Signature viewing area of the LCD screen can also be set up in quadrants to show positive and
negative current and voltage characteristics. Refer to figure 2-8.
Figure 2-8. LCD Display Horizontal Axis and Graticule Lines.
When the test signal is positive, this means that the voltage and current are positive so the signature's
trace is on the right hand side of the LCD display. When the test signal is negative, the voltage and
current are negative so the trace is in the left hand side of the display.
Turn on the Tracker 2800 and observe the LCD display. With nothing connected to its test terminals,
the display trace is a horizontal line (R
L
=) as shown in figure 2-9.