Tracker-2800-2800S.pdf - 第48页
48 3-3. INDUCTORS Inductors, like capacitors, have elliptic al analog signatures and respond to Tracker 2800's test signal non-linearly. Also like capacitors, an inductor's rea ctance (resistance to an AC te st…

47
Applications
The Tracker 2800 can locate defective capacitors in or out of circuit. The ranges cover 100 pF to
15,000 F.
When analyzing a capacitor's signature, adjust the Tracker 2800's R
S
and F
S
for the most
pronounced ellipse.
The test signal frequency F
S,
can be changed to enhance a composite signature by emphasizing or
de-emphasizing the capacitance.
Besides resistance, faulty capacitor signatures often exhibit other irregularities such as non-
symmetry, broken or distorted ellipse and saw-toothed shapes that can be seen in the signature
display.
48
3-3. INDUCTORS
Inductors, like capacitors, have elliptical analog signatures and respond to Tracker 2800's test signal
non-linearly. Also like capacitors, an inductor's reactance (resistance to an AC test signal) is dependent
on the test signal's frequency. Because of the way they are constructed using wire with some amount of
resistance in it, it is hard to find a pure inductance. An inductor's analog signature will usually be an
elliptical pattern with some slope or tilt to it due to the resistance of the coil wire.
Inductive Signatures
The goal of this section is to explore some inductive signatures and to help you understand how
inductor signatures are related to:
The inductance (L µH) of the circuit under test
The frequency (F
S
) of the test signal
The voltage (V
S
) of the test signal
The internal resistance (R
S
) of the Tracker 2800
Plug the red test microprobe in the Channel A jack, and the black test clip lead in the Common jack.
Do the following to display the analog signature of an inductor:
1. Select 50, 10V and 60Hz range (LOW Range)
2. Place or clip each test lead on the opposite ends of an inductor and observe the signature in the
Tracker 2800 signature display.
Signatures of Different Inductor Values
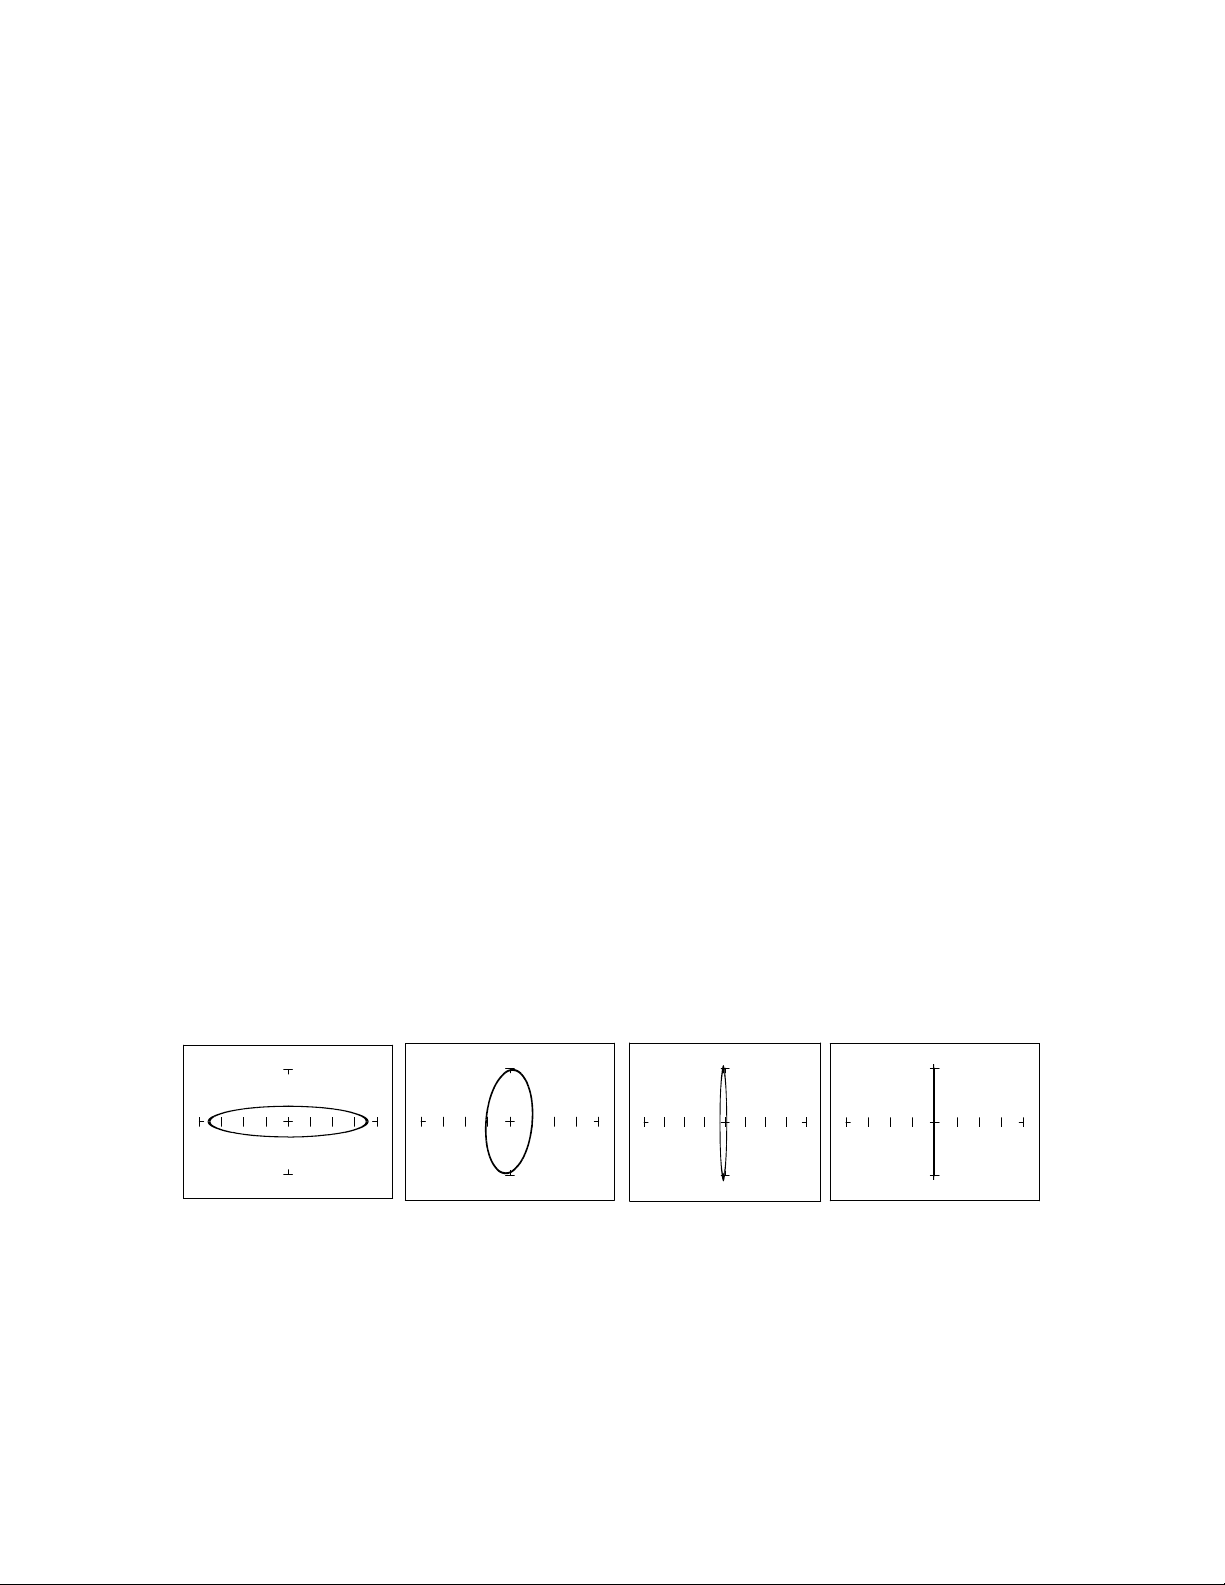
The figure below shows analog signatures for four different value inductors, 12,000 µH, 1200 µH, 120
µH and 12 µH. Select 10V, 50, 2KHz.
12,000 µH 1,200 µH 120 µH 12 µH
Figure 3-17. Signatures of 4 Inductors at 10 V, 50, 2KHz.
Note that as the inductance values decrease, each signature changes from a horizontal elliptical pattern
to a vertical elliptical pattern. In ASA, a large value inductor has a signature that looks similar to an
open circuit. And likewise, a small value inductor has a signature that's similar to a short circuit.
49
Effect of Frequency Changes on Inductive Signatures
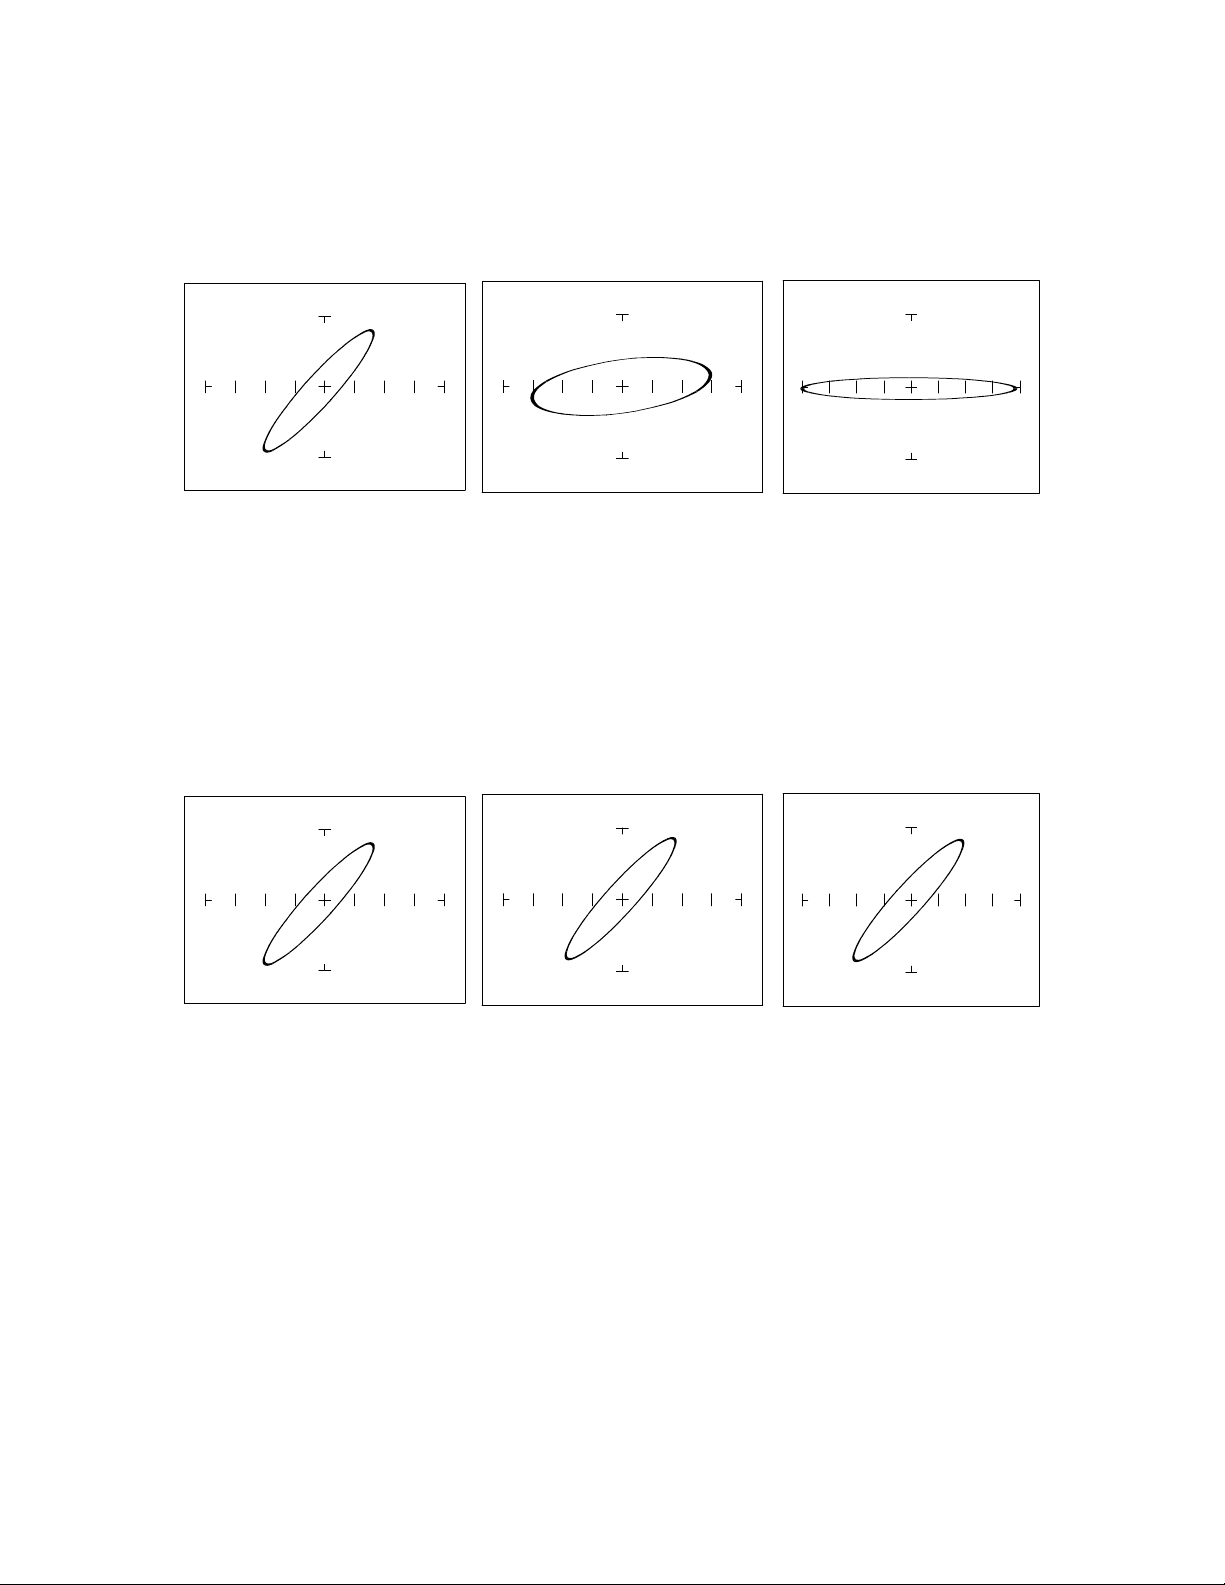
Select 10V, 50, 60Hz. Then Select 1KHz and 2KHz.
F
S
= 60 Hz F
S
= 1KHz F
S
= 2KHz
Figure 3-18. Effect of varied F
S
on 12,000 µH Inductor Signatures.
Note that the signature changes from a vertical position to a horizontal position as the frequency
increases. This means the resistance of an inductor increases as frequency increases.
Effect of Voltage Changes on Inductive Signatures
Select 200mV, 50, 60Hz. Then Select 5V and 10V.
V
S
= 200 mV V
S
= 5 V V
S
= 10 V
Figure 3-19. Effect of varied V
S
On 12,000 µH Inductor Signatures.
Note that the signature does not change at the three test signal voltages. This means that the inductor's
resistance is not affected by changes in the test voltage.