Tracker-2800-2800S.pdf - 第37页
37 To display the analog signature of a resistor: 1. Select the Tracker tab of the Signature pane of the Huntron Workstatio n Software. 2. Select the 50 ohm range by clicking the Resistan ce dropdown button and selecti n…
36
SECTION 3 TESTING PASSIVE COMPONENTS
3-1. RESISTORS
Exploring how the Tracker 2800 ranges interact with different resistance values is a good introduction
on how basic ASA troubleshooting is applied. This section will briefly familiarize you with Tracker
2800 basic operation and teach you how resistor signatures relate to both test range and the resistance
of the circuit under test. After completing this section, you will know how to:
Apply test probes across a resistor
Identify a pure resistive signature
Analyze and predict resistive signatures
As you go through the following section, make a mental note on the relationship between the Tracker
2800's test range parameters: voltage, resistance and frequency.
Put the red test lead in the Channel A jack, and the black test lead in the Common jack.
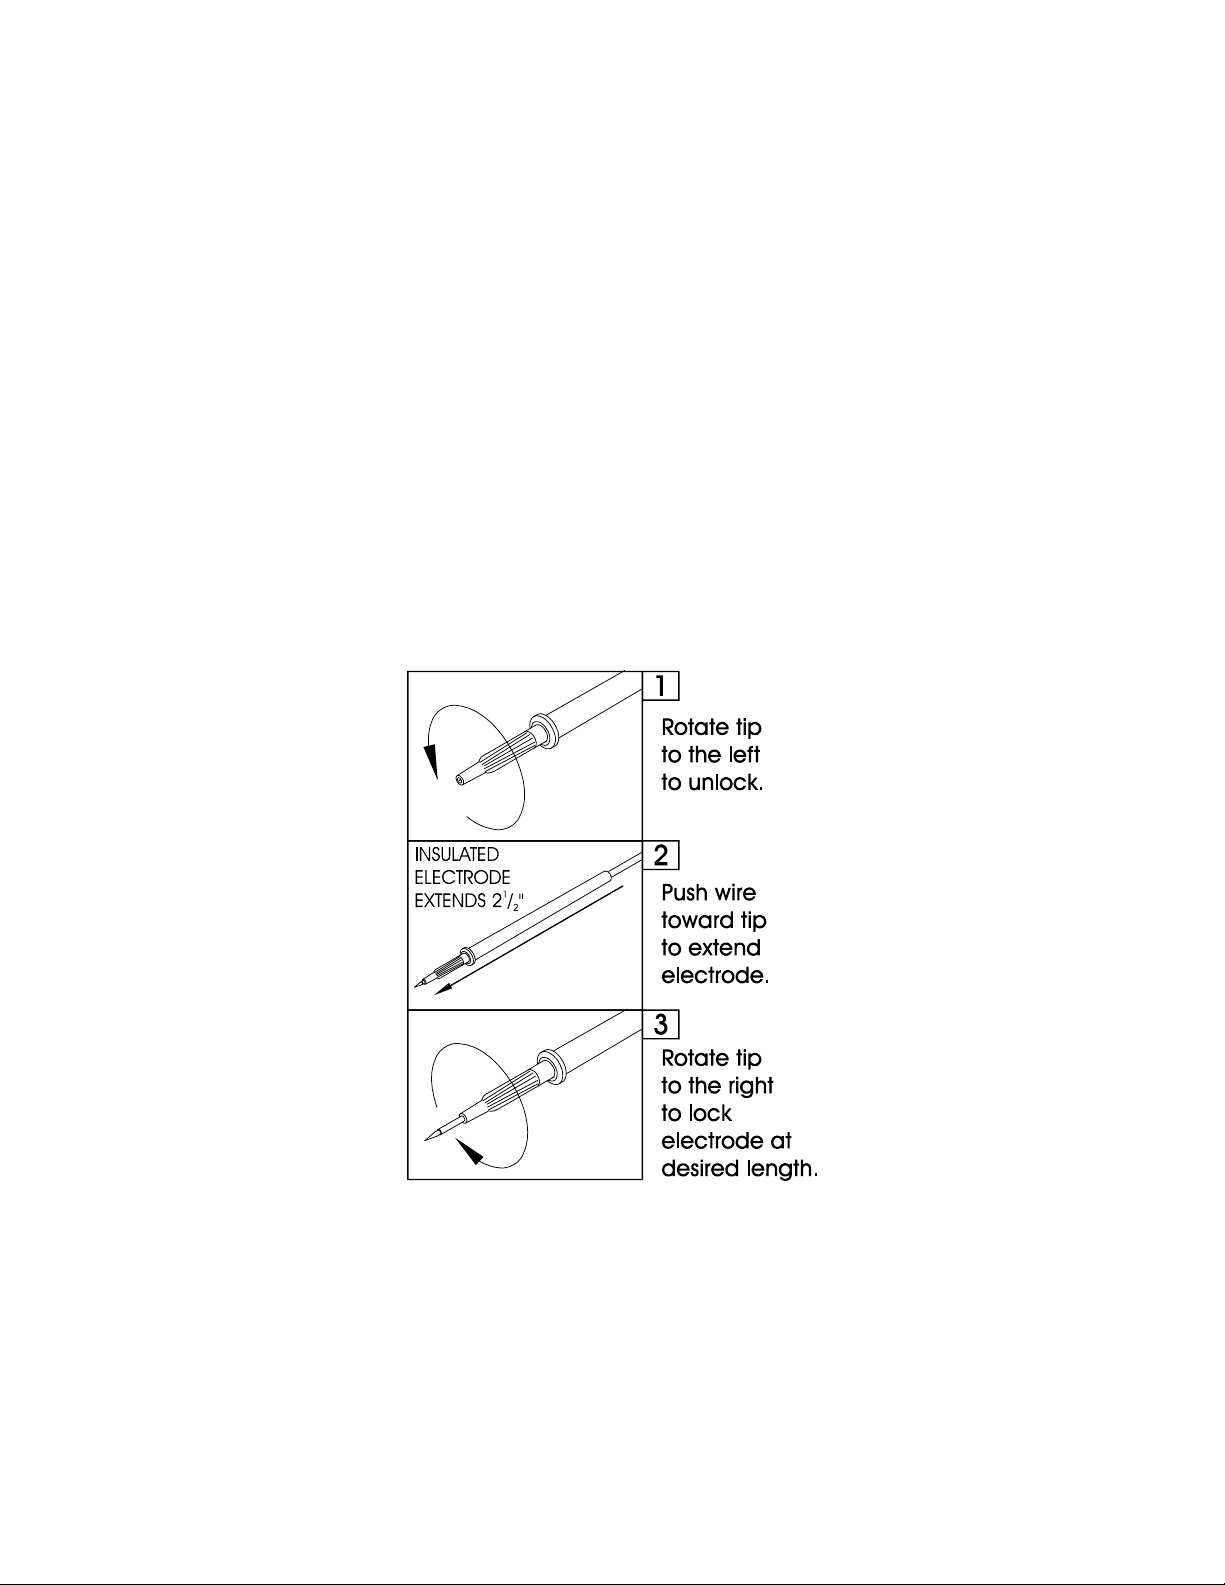
Micro Probe Adjustment (Do not over-tighten the tip in step 3):
Figure 3-1. Huntron MicroProbe Adjustment.
37
To display the analog signature of a resistor:
1. Select the Tracker tab of the Signature pane of the Huntron Workstation Software.
2. Select the 50 ohm range by clicking the Resistance dropdown button and selecting 50.
3. Place or clip a test lead on the opposite ends of a resistor and observe the signature.
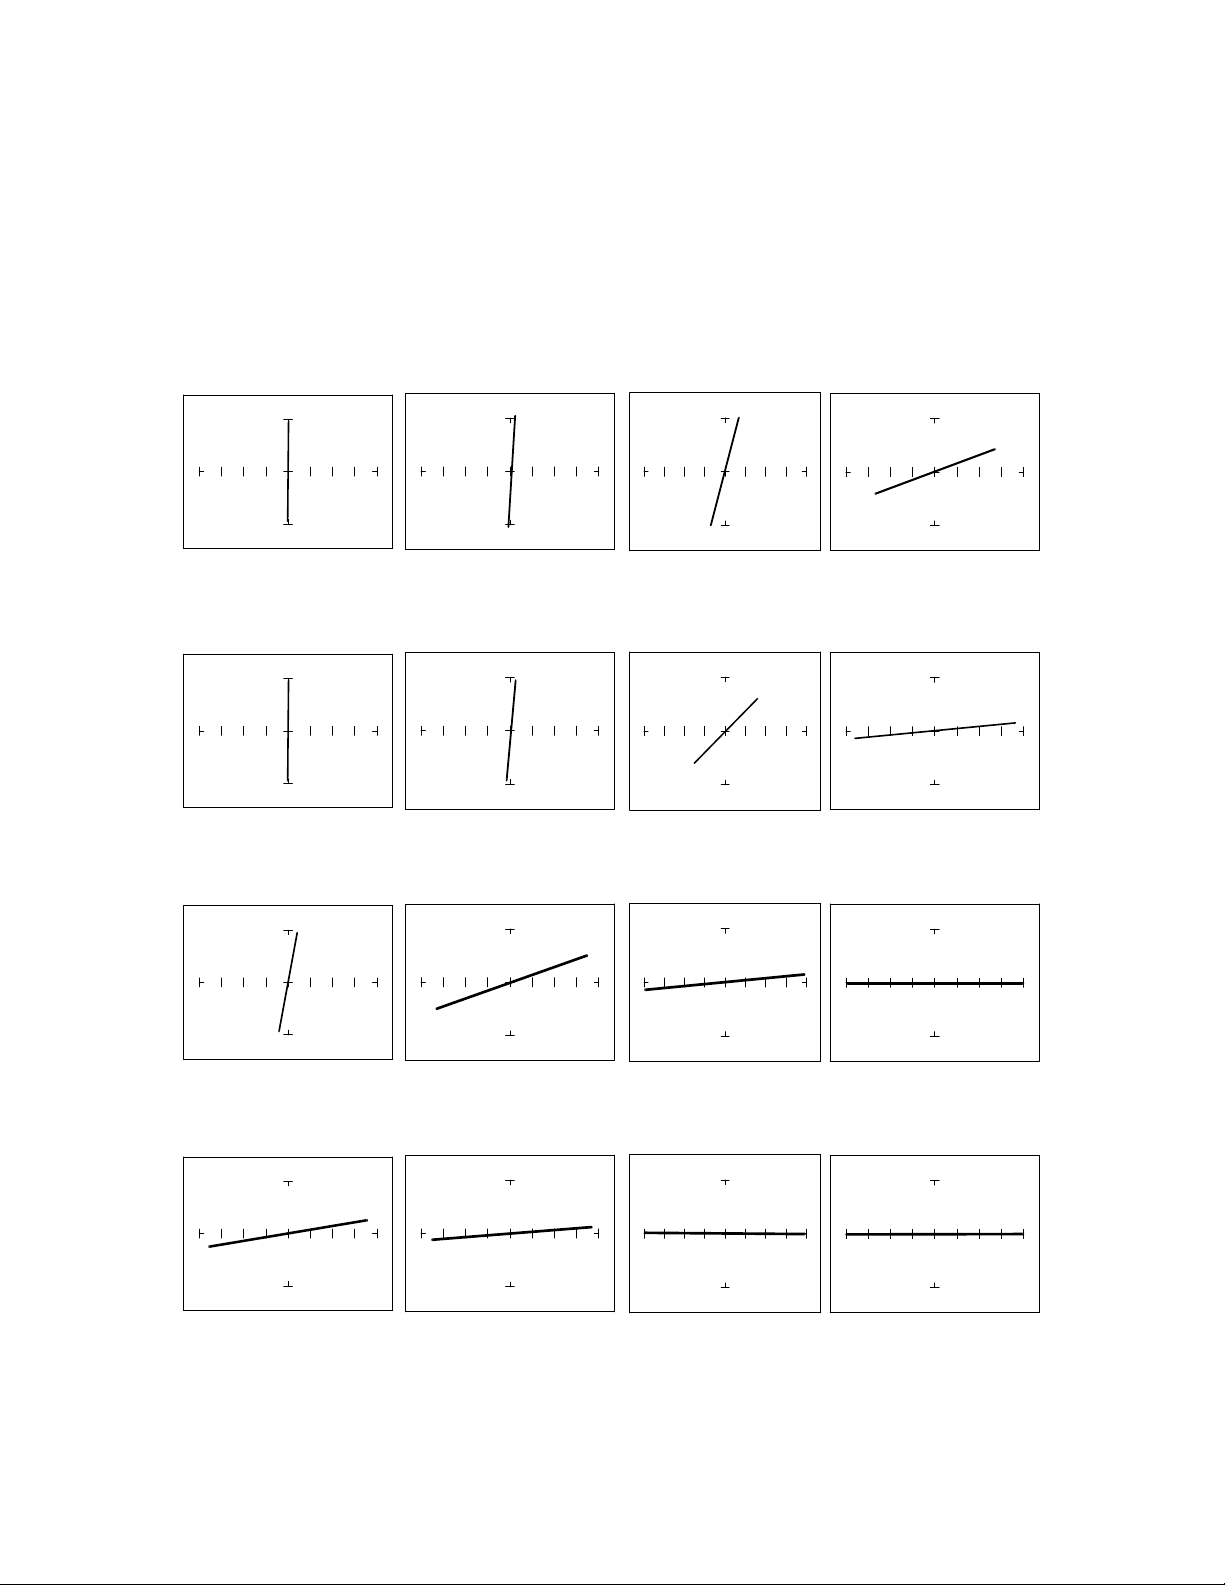
Below are four analog signatures of different resistors, 150, 1.5 k, 15 k and 150 k ohms in each of the
four Ranges. Note how the slope or angle of each analog signature changes with each resistor's value.
100 1 k 10 k 100 k
Vs=20V, Rs=100kFs=200Hz
100 1 k 10 k 100 k
Vs=20V, Rs=10k Fs=200Hz
100 1 k 10 k 100 k
Vs=15V, Rs=1k Fs=200Hz
100 1 k 10 k 100 k
Vs=10V, Rs=10 Fs=200Hz
Figure 3-2. Signatures of Different Resistors in 4 Ranges.
38
Now that you have an idea of what the signatures of different resistor values look like in different
ranges, the next part will give you an idea of what happens when you vary R
S
source resistance, V
S
source voltage and F
S
source frequency of the Tracker 2800 and how it affects the resistive analog
signature.
The Effect of R
S
on Resistor Analog Signatures.
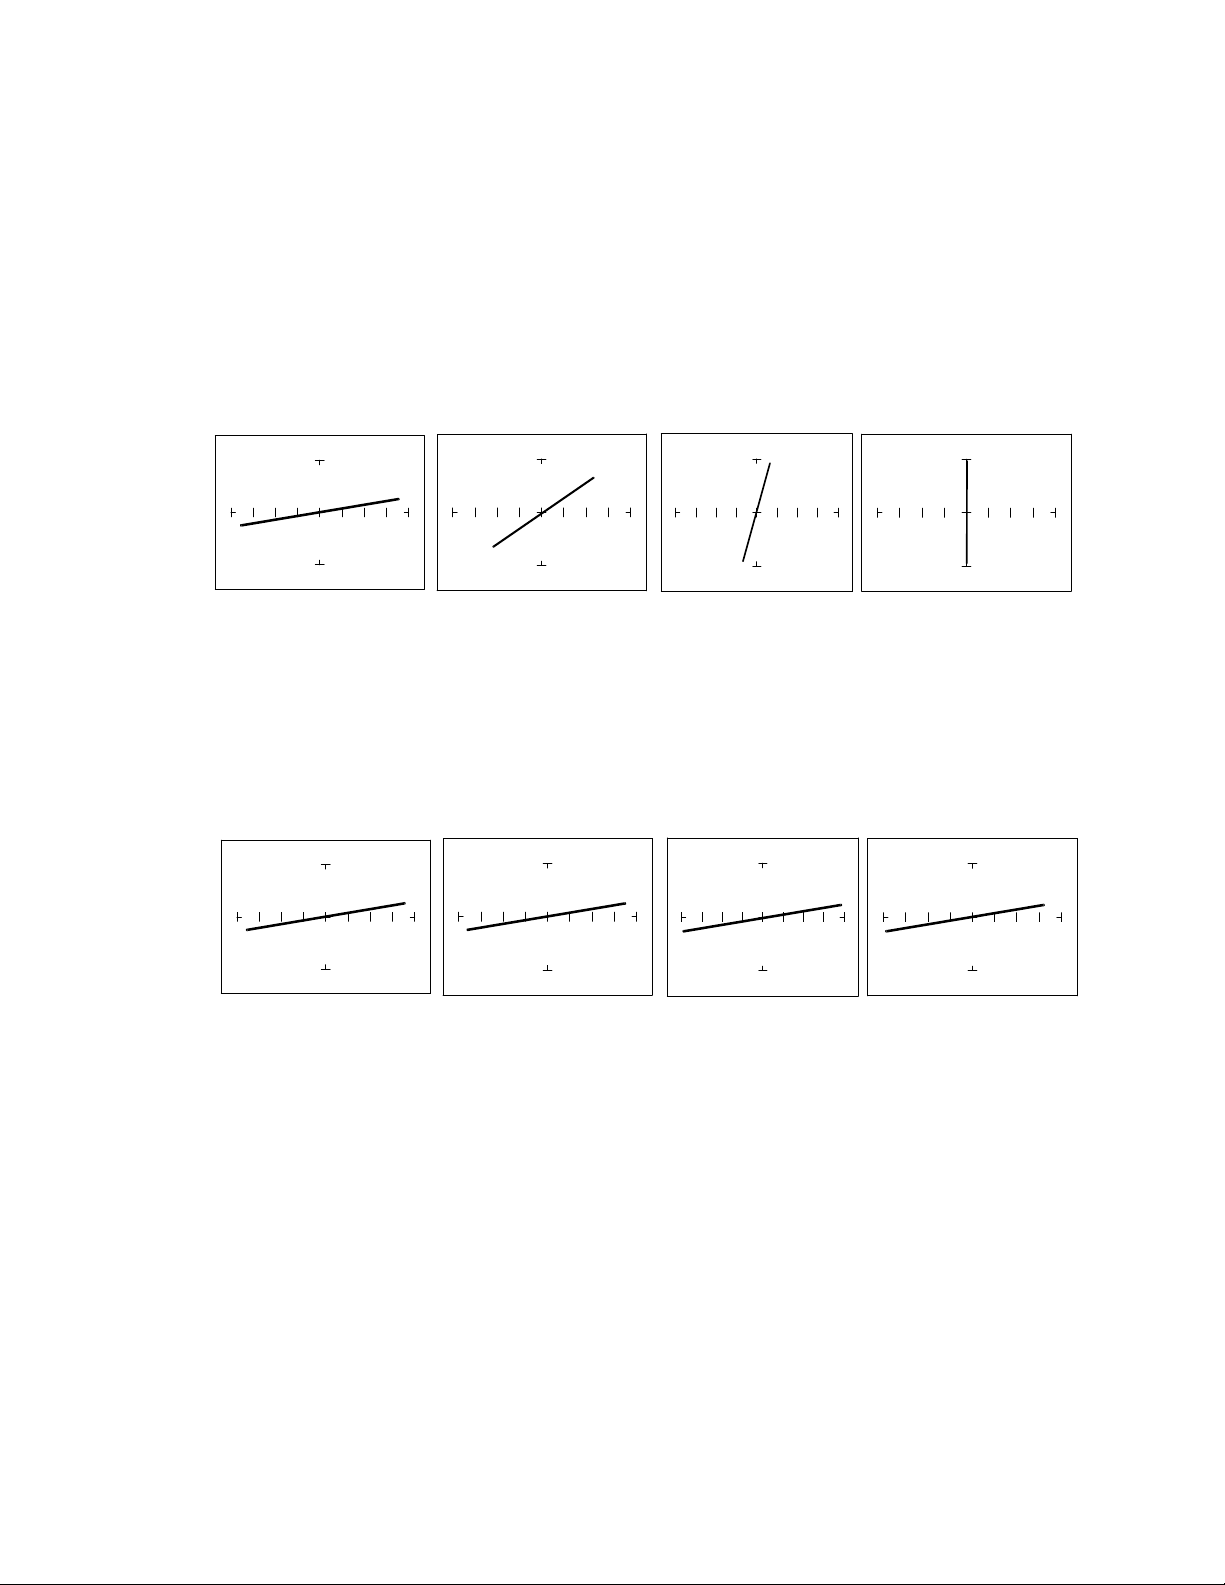
Select the 10V, 50 and 200Hz. Change the resistance range to 200, 1K and 5K.
Observe the signatures for a 100 ohm resistor in the figure below as R
S
varies. Note how these resistor
signatures respond to changing Tracker 2800's internal resistance.
R
S
= 50 R
S
= 100 R
S
= 1K R
S
= 10K
Figure 3-3. Effect of Varying R
S
on a 100Resistor Signature
The Effect of V
S
on Resistor Analog Signatures.
Select the 10V, 50 and 200Hz. Change the voltage range to 5V, 2V and 200mV.
V
S
= 10V V
S
= 5V V
S
= 2V V
S
= 500mV
Figure 3-4. Effect of Varying V
S
on a 100 Resistor Signature.
Observe that these signatures do not change with the changing voltage. Note that Vs cannot be set
above 10V because R
S
is set to a value of 50 . This limit on range parameter combinations is a result
of the Tracker 2800's STAR feature. It protects components from possible excessive power levels. In
order to set V
S
to a higher voltage, you must change R
S
to a higher value first.