00193407-02 HWWS SIPLACE Machine Accuracy EN.pdf - 第69页
© Siemens AG . . Änderungen vorbehalten SIPLACE Placement Systems set point (specification limit) calculated value (sigma limit) frequency plot: Gaussian Bell curve set point value (specification limit e.g. +- 90 um) -11…

© Siemens AG . . Änderungen vorbehalten
SIPLACE
Placement Systems
0.00 25.00 50.00 75.00 100.00 125.00 150.00 175.00 200.00
-100
-80
-60
-40
-20
0
20
40
60
80
100
offset [µm]
single value diagram
placement 1: X-offset
cm = 1.99, cmk = 1.98
placement 1: Y-offset
cm = 1.94, cmk = 1.83
Regression line (best adjustment of a line to the measured values)
number of placement
X/Y-axis
graphical evaluation: color atlas
Measurement Project in General
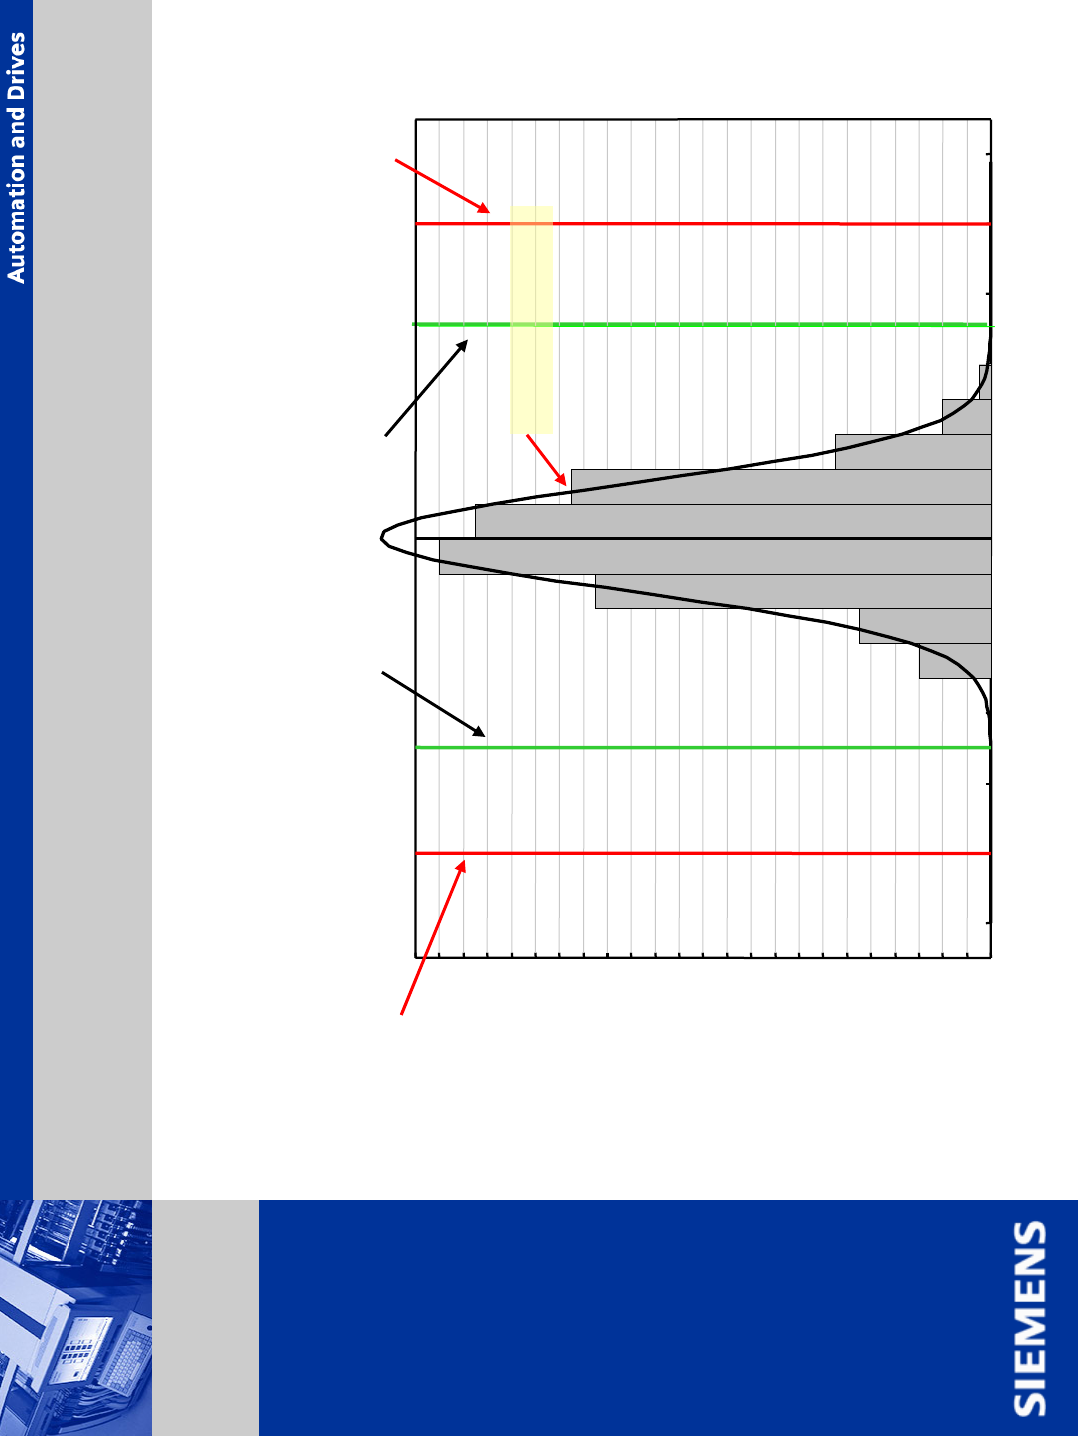
© Siemens AG . . Änderungen vorbehalten
SIPLACE
Placement Systems
set point
(specification limit)
calculated value (sigma limit)
frequency plot: Gaussian Bell curve
set point value
(specification limit
e.g. +- 90 um)
-110.0 -90.0 -70.0 -50.0 -30.0 -10.0 10.0 30.0 50.0 70.0 90.0 110.0
0
2
4
6
8
10
12
14
16
18
20
22
24
26
28
30
32
34
36
38
40
42
44
46
48
Gaussian bell curve
Measurement Project in General

© Siemens AG . . Änderungen vorbehalten
SIPLACE
Placement Systems
X-Y-diagram: placement 1
-100.0 -75.0 -50.0 -25.0 0.0 25.0 50.0 75.0 100.0
x-offset [µm]
-100
-80
-60
-40
-20
0
20
40
60
80
100
y-offset [µm]
set point value
(specification limit)
sigma-ellipse (limit)
X-axis
Y-axis
graphical evaluation: X-Y plot
Measurement Project in General