00193407-02 HWWS SIPLACE Machine Accuracy EN.pdf - 第9页
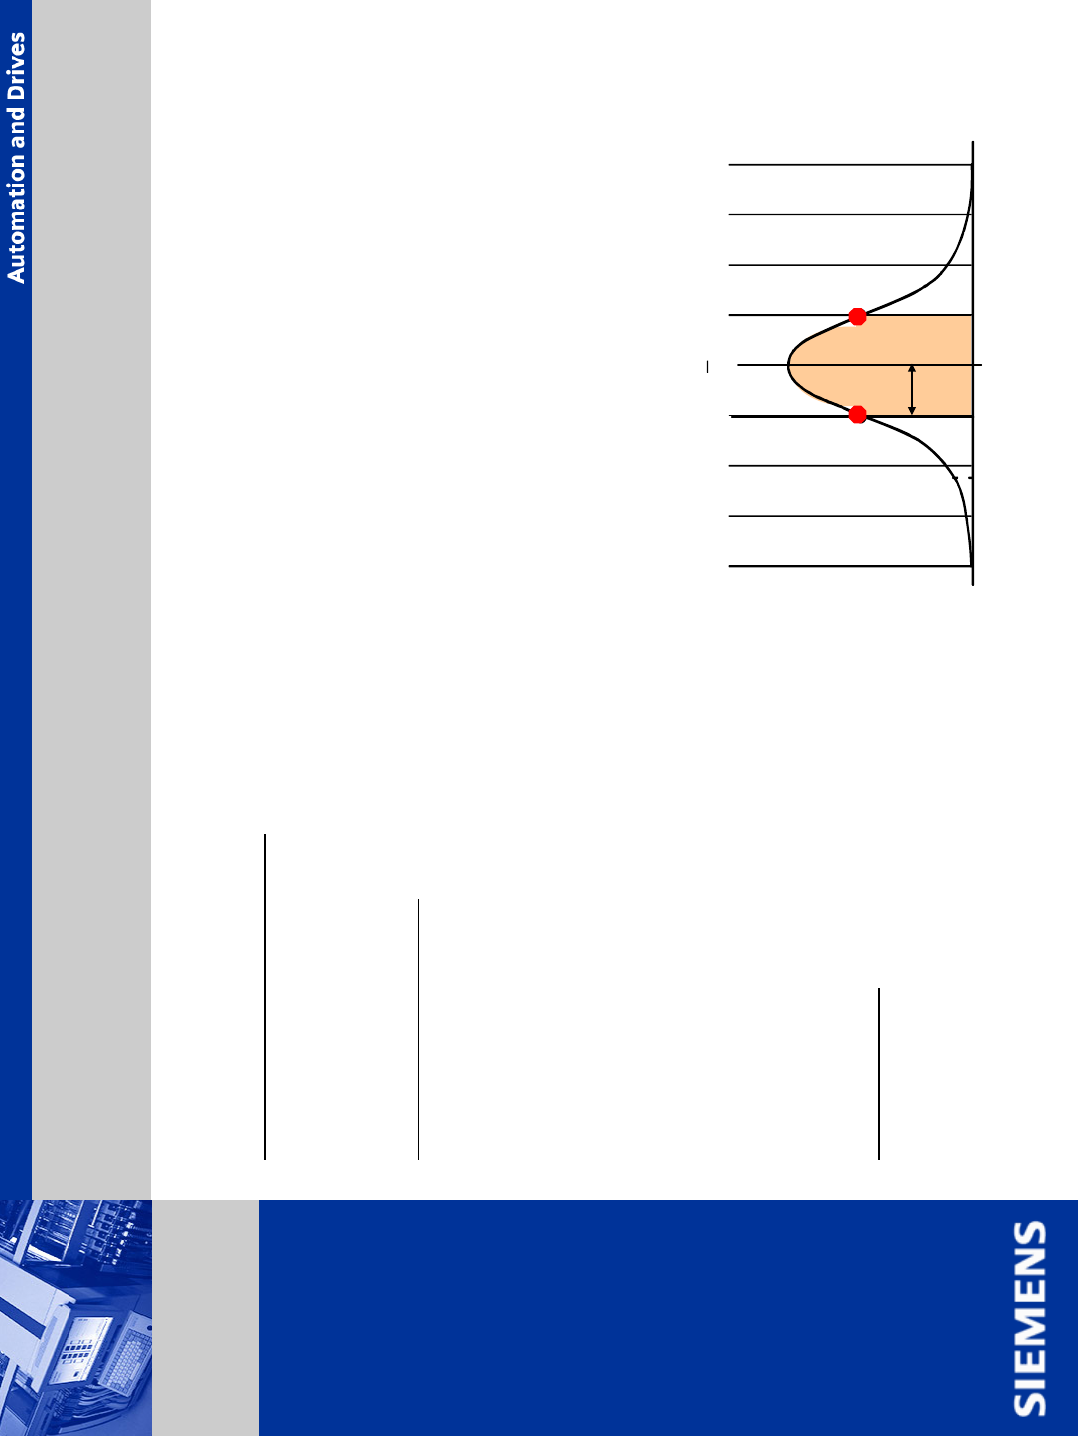
© Siemens AG . . Änderungen vorbehalten SIPLACE Placement Systems turn around point standard deviation 1 sigma -1s -2s +2s +1s m turn around point Machine Capability

© Siemens AG . . Änderungen vorbehalten
SIPLACE
Placement Systems
Placement Accuracy
What does a statement of placement accuracy +- 50 um at 4 sigma mean?
The 4 sigma limit value of the normally distributed deviation of the placement position is 50 um.
This enables the user to rate the reliability of the placement process.
The defect probability at 4 sigma is 60 ppm. The user can assume that placement error exceeds
50 um for only 60 out of one million placed components.
Limit value: 37.5 um (3 sigma) 2600 ppm
50,0 um (4 sigma) 60 ppm
75,0 um (6 sigma) 0.002 ppm
During this process, it becomes obvious that identical placement accuracy can be described in
different ways. The statements 50 um at 4 sigma, 25 um at 2 sigma and 75 um at 6 sigma are
equivalent, the standard distribution = 12.5 um.
Factors influencing placement accuracy:
¾ placement machine
¾ tolerances and twist of the PCB
¾ dimensional accuracy of the components
¾ bending of component pins
¾ ..........................
Machine Capability

© Siemens AG . . Änderungen vorbehalten
SIPLACE
Placement Systems
turn around point
standard
deviation
1 sigma
-1s-2s
+2s
+1s
m
turn around point
Machine Capability
© Siemens AG . . Änderungen vorbehalten
SIPLACE
Placement Systems
Statistical Process Control
The goal of Statistical Process Control (SPC) is not to determine or to describe the quality of a process by
using 100% inspection, but to use small samples to determine the quality of the process.
Standard Distribution
The standard distribution is illustrated graphically as a bell-shaped curve .
The diagram below shows the standard deviation 12,5 um.
Expressed statistically: at the peak of the bell-shape curve, 68.26% of all placements have a max. deviation
of 12,5 um from set-point value.
It can also be explained: a component which requires a placement accuracy of 50 um can be
placed with 4 sigma, based on this statistical distribution.
The defect placement rate here is 60 dpm (defects per million).
When comparing specifications of placement machines, the statistical base must be identical.
Two values specifically determine the appearance
of the bell-shaped curve:
average value and standard distribution
graph right side:
average value (no offset)
standard distribution 12.5 um (1 sigma)
x-4
σ
-3
σ
-2
σ
σ
4
σ
3
σ
2
σ
σ
-50 -37,5 -25 -12.5
0
12,5
25
37.5 50
μ
m
1
s
i
g
m
a
Machine Capability