00193370-0202.pdf - 第69页
SIPLACE Axis T est er Handbuch für das Achsprüfgerät / Axis T est er Manual Ausgabe 08/2003 Edition 8 Using the menus 69 Fig. 8 - 23 “P roperties” menu 8.4.3 T esting the axis positioning quali ty Æ Se lect the “P os. qu…
Handbuch für das Achsprüfgerät / Axis Tester Manual SIPLACE Axis Tester
8 Using the menus Ausgabe 08/2003 Edition
68
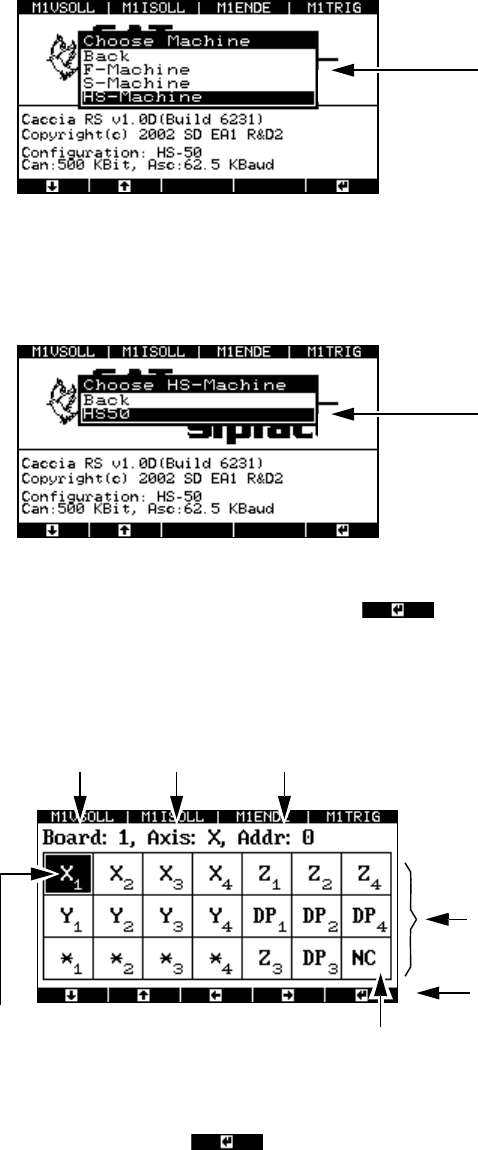
8.4.1 Selecting a machine
Fig. 8 - 20 Selecting the “Machine” menu
The wafflepack changer can be found under F machine.
Æ Select a class of placement machine, e.g. HS machine.
Fig. 8 - 21 Selecting the “Machine type” menu
Æ Move the cursor onto HS-50 and press to confirm your choice. The window for con-
figuring the axis controllers in the control unit appears.
8.4.2 Selecting an axis
Fig. 8 - 22 Axis controller display, configuration
Æ Select the required axis by using the cursor keys to move the black marker onto the field con-
cerned. Then press to confirm your choice.
The window for displaying the axis properties appears.
There is a separate menu for each class of
machine, i.e. 1-gantry, 2-gantry or 4-gantry
machines.
Accesses the configuration menu for the
HS-50 placement machine
The selected axis has
a black background
Axis board no. 1 X axis Address 0
Not used
This display corresponds to the address
-
ing in the HS-50 control unit.
This display corresponds to the arrange-
ment in the HS-50 control unit.
Cursor keys for defining the axis selection
SIPLACE Axis Tester Handbuch für das Achsprüfgerät / Axis Tester Manual
Ausgabe 08/2003 Edition 8 Using the menus
69
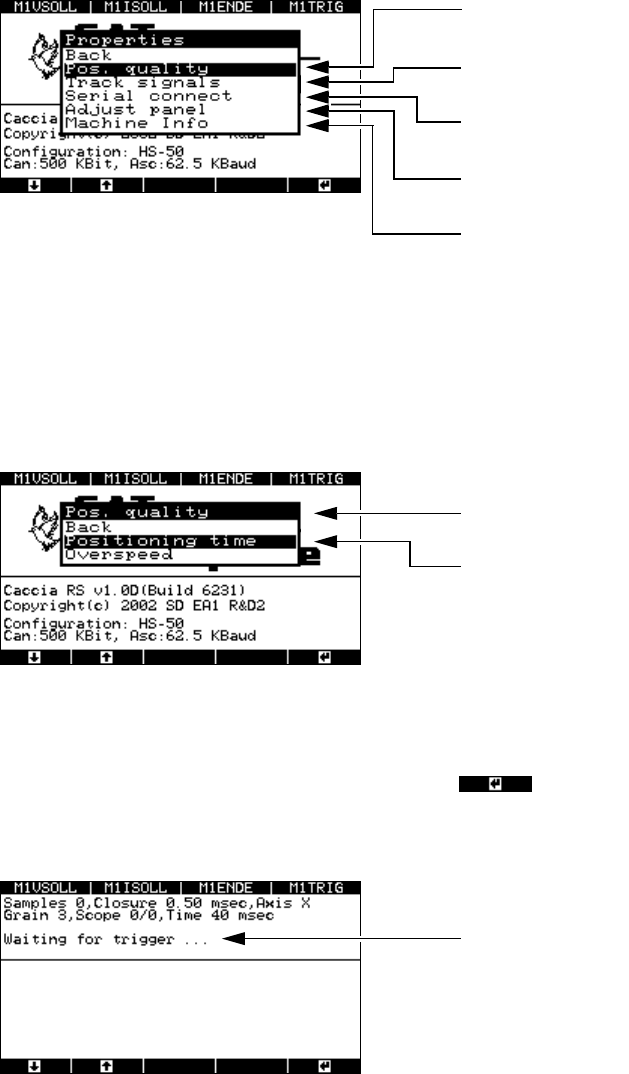
Fig. 8 - 23 “Properties” menu
8.4.3 Testing the axis positioning quality
Æ Select the “Pos. quality” menu from the “Properties” window.
The following window appears.
Fig. 8 - 24 Selecting the “Pos. quality” menu
8.4.3.1 “Positioning time” menu
Æ Select the “Positioning time” menu option and press .
The next window indicates that the axis tester is ready to receive the time and positioning
movement.
Fig. 8 - 25 “Waiting for trigger” menu
Æ Now use the SITEST program and the traversing path data from the setting instructions to start
the axis. The position data is recorded, and the positioning movement is displayed graphically
on screen.
This menu is used to analyze the position
-
ing quality and counting errors.
This menu is used to analyze the track
signals.
Use this menu to look up the axis controller
statuses.
Accepts the default parameters for the se-
lected axis.
This window contains information about the
axis currently being tested.
You can use this menu to test the axis
settings.
This menu helps you to analyze counting
errors.
The axis tester is ready to receive the
measured data.
Handbuch für das Achsprüfgerät / Axis Tester Manual SIPLACE Axis Tester
8 Using the menus Ausgabe 08/2003 Edition
70
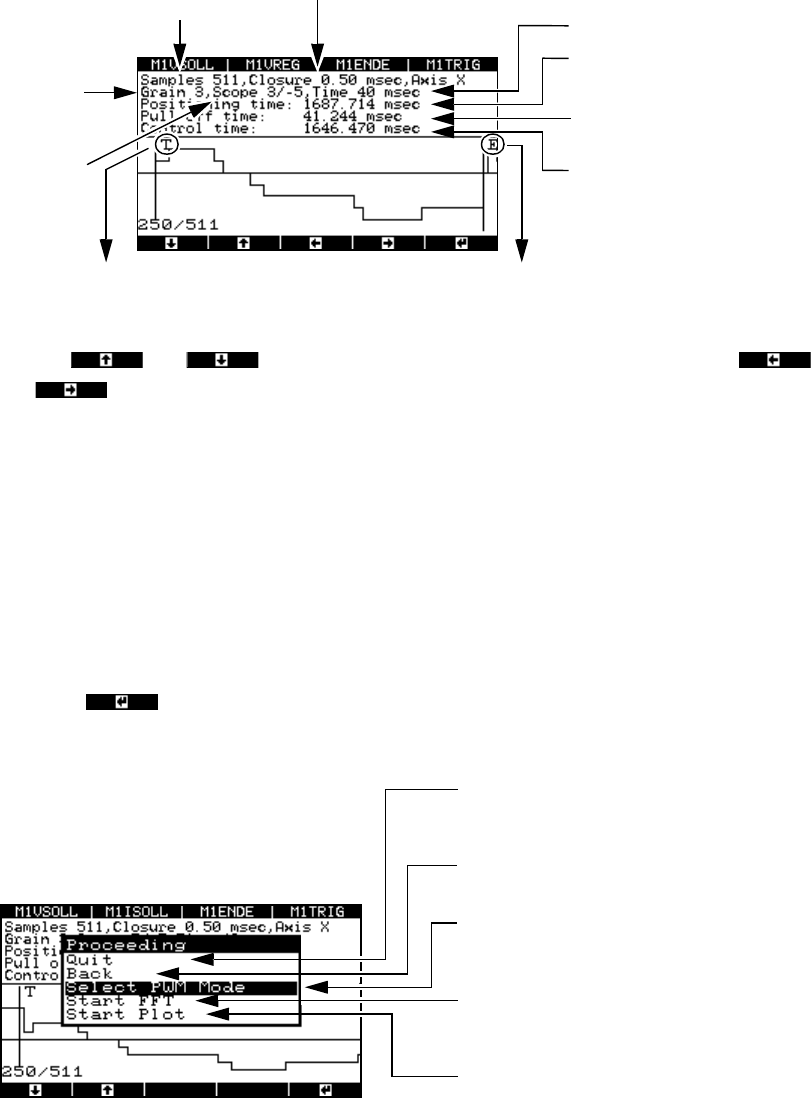
Fig. 8 - 26 Graphical representation of the positioning movement
Use the and cursor keys to move the zero line up or down and the
and cursor keys to move the display area to the left or right.
The pull-off time is calculated as the time difference between the falling edge of the trigger sig-
nal (when the desired position is reached for the first time) and the end signal.
8.4.3.2 Analyzing and documenting positioning movements
Once you have recorded the positioning movement, you can plot it or make the signals available
at the BNC outputs for an oscilloscope.
Æ Press the button.
The “Proceeding” window appears.
Fig. 8 - 27 “Proceeding” menu
*) The pulse width-modulated signal remains at the BNC socket until the menu window is closed by pressing
any button. During this time, a menu window is displayed to inform you that the signal is present at the
BNC socket.
T = falling edge of the trigger signal
Number of
samples
Time base
Display
resolution
in pixels
Amplitude
scaling
in digits
Width of the sampling windo
w
Positioning time
(End signal)
Pull-off time
Trigger signal time, i.e. the ti
me
from the start until the desire
d
position is reached for the fir
st
time
E = falling edge of the end signal
t
Po
t
T
t
E
–=
Select “Quit” to return to the “Positioning
time” menu, where you can start a new
measurement.
Click on “Back” to display the “Positioning
movement” image.
Outputs the pulse width-modulated signal to
an oscilloscope connected to the BNC
socket.
Fast Fourier Transform (spectral analysis o
f
the positioning movement – under prepara
-
tion)
Outputs the graph to the serial port with the
plotter or printer