00193370-0202.pdf - 第71页
SIPLACE Axis T est er Handbuch für das Achsprüfgerät / Axis T est er Manual Ausgabe 08/2003 Edition 8 Using the menus 71 PLEASE NOTE: 8 Y ou cannot a ccess the “Se lect PWM mode”, “S tart FFT” and “S tart pl ot” menus u …
Handbuch für das Achsprüfgerät / Axis Tester Manual SIPLACE Axis Tester
8 Using the menus Ausgabe 08/2003 Edition
70
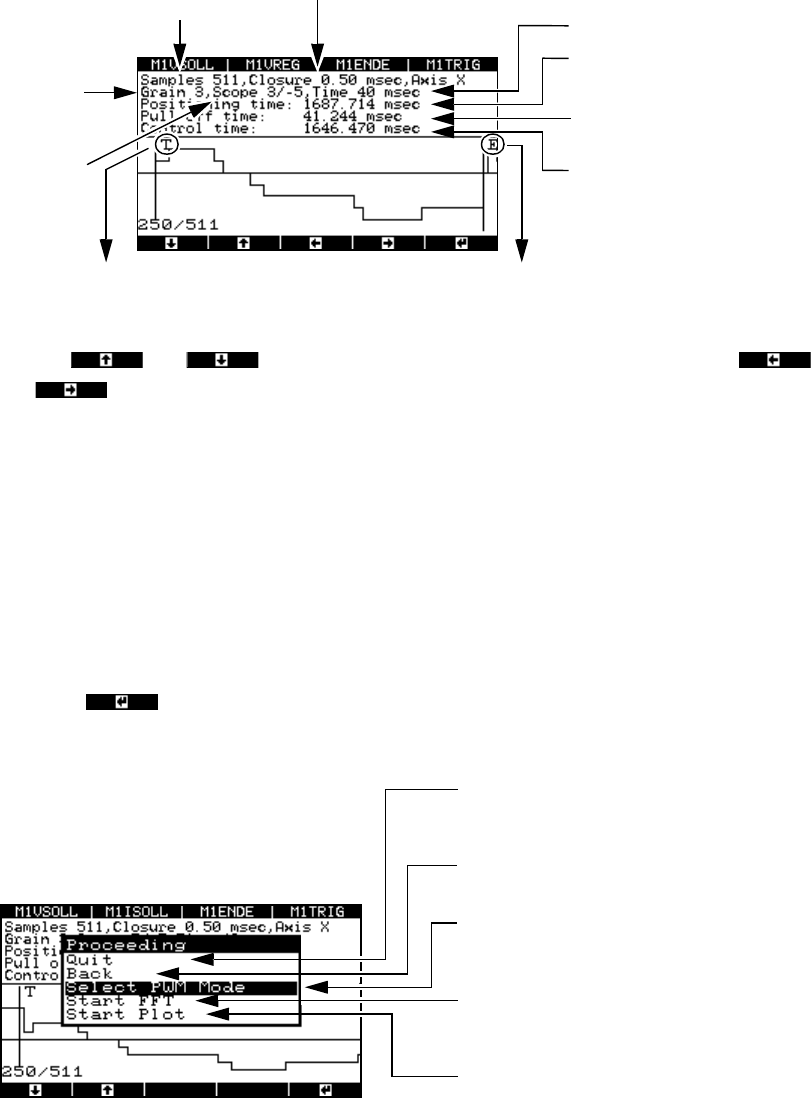
Fig. 8 - 26 Graphical representation of the positioning movement
Use the and cursor keys to move the zero line up or down and the
and cursor keys to move the display area to the left or right.
The pull-off time is calculated as the time difference between the falling edge of the trigger sig-
nal (when the desired position is reached for the first time) and the end signal.
8.4.3.2 Analyzing and documenting positioning movements
Once you have recorded the positioning movement, you can plot it or make the signals available
at the BNC outputs for an oscilloscope.
Æ Press the button.
The “Proceeding” window appears.
Fig. 8 - 27 “Proceeding” menu
*) The pulse width-modulated signal remains at the BNC socket until the menu window is closed by pressing
any button. During this time, a menu window is displayed to inform you that the signal is present at the
BNC socket.
T = falling edge of the trigger signal
Number of
samples
Time base
Display
resolution
in pixels
Amplitude
scaling
in digits
Width of the sampling windo
w
Positioning time
(End signal)
Pull-off time
Trigger signal time, i.e. the ti
me
from the start until the desire
d
position is reached for the fir
st
time
E = falling edge of the end signal
t
Po
t
T
t
E
–=
Select “Quit” to return to the “Positioning
time” menu, where you can start a new
measurement.
Click on “Back” to display the “Positioning
movement” image.
Outputs the pulse width-modulated signal to
an oscilloscope connected to the BNC
socket.
Fast Fourier Transform (spectral analysis o
f
the positioning movement – under prepara
-
tion)
Outputs the graph to the serial port with the
plotter or printer
SIPLACE Axis Tester Handbuch für das Achsprüfgerät / Axis Tester Manual
Ausgabe 08/2003 Edition 8 Using the menus
71
PLEASE NOTE: 8
You cannot access the “Select PWM mode”, “Start FFT” and “Start plot” menus until you have
recorded a positioning movement. 8
8.4.3.3 Sending the positioning movement to the oscilloscope (“Select PWM mode” menu)
You can send the positioning movement as a pulse width-modulated signal to an oscilloscope for
further analysis. The PW0 … PW3 outputs are permanently assigned to panels BNC1 ... BNC4,
i.e. if you wish to display the signal for the X1 axis (top axis controller in the module), the previous
assignment of BNC1 is overwritten with the assignment to the PWM0 signal. If you wish to retain
the old assignment, then you must reconfigure M1VSOLL (see section 6.2
“Configuration” menu
on page 54
).
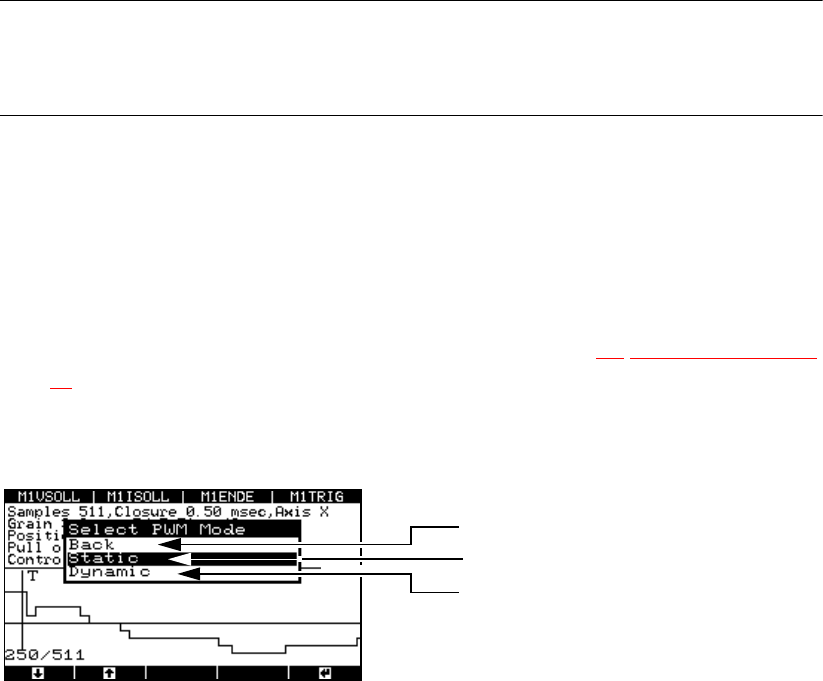
Æ Select the “Select PWM mode” option from the “Proceeding” menu. The “Select PWM mode”
menu appears.
Fig. 8 - 28 “Select PWM mode” menu
“Static” PWM mode
If you select this mode, the positioning movement is recorded once after the falling edge of the
trigger signal, and is then output. If there is no trigger signal, then the positioning movement is
output from the falling edge of the end signal.
“Dynamic” PWM mode
If you select this mode, the positioning movement is recorded and output to the oscilloscope
continuously from the falling edge of the trigger signal or end signal.
Returns to the “Proceeding” menu
PWM mode: Static
PWM mode: Dynamic
Handbuch für das Achsprüfgerät / Axis Tester Manual SIPLACE Axis Tester
8 Using the menus Ausgabe 08/2003 Edition
72
Æ Select this option if you wish to test the axis in continuous operation.
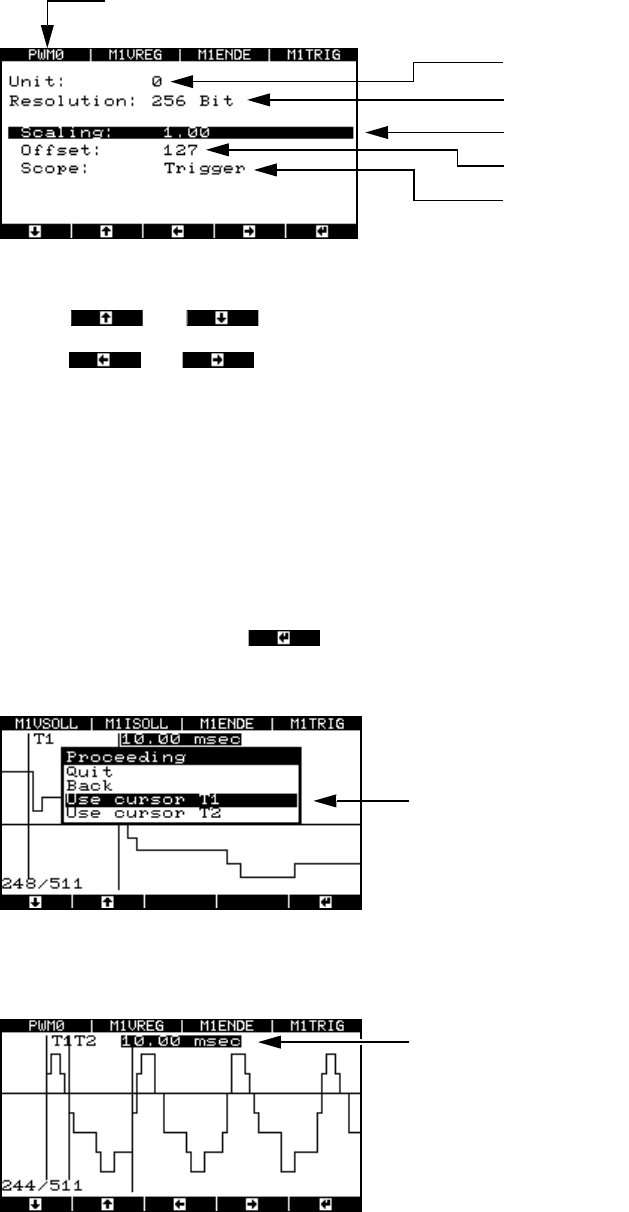
Fig. 8 - 29 Parameter display for the pulse width-modulated signal
Use the and cursor keys to select the parameters.
Use the and cursor keys to increase or reduce numerical values or select the
trigger signal.
8.4.3.4 Analyzing the positioning movement using FFT (“Start FFT” menu)
To provide further details for the analysis, we plan to output the positioning movement as a spec-
trum using the FFT.
8.4.3.5 Outputting to a plotter (“Start plot” menu)
Æ Select “Start plot” and press .
The window for selecting the time range appears.
Fig. 8 - 30 Menu for selecting the plot area
Æ Select marker T1.
Multiplexer output
Resolution
Scaling factor
Zero line offset in digits
Starting edge:
Trigger signal (A361 or higher) or en
d
signal (A360)
PWM0 signal output (top axis controller) at BNC1.
Time marker T1 and time marker
T2 for determining the time win-
dow
Time window for the selected plot area