S1.pdf - 第14页
Slide 14 0 20 40 60 80 100 120 Au g - 16 Nov - 16 M a r - 17 Jun - 17 S e p - 1 7 D ec- 17 Ap r-18 Jul- 18 Oct- 18 F e b - 1 9 Par t i cl e s adde d t o r e ti cl e f r ont -s i de pe r 1 0 ,0 0 0 w af e r ex pos ur e s …
Slide 13
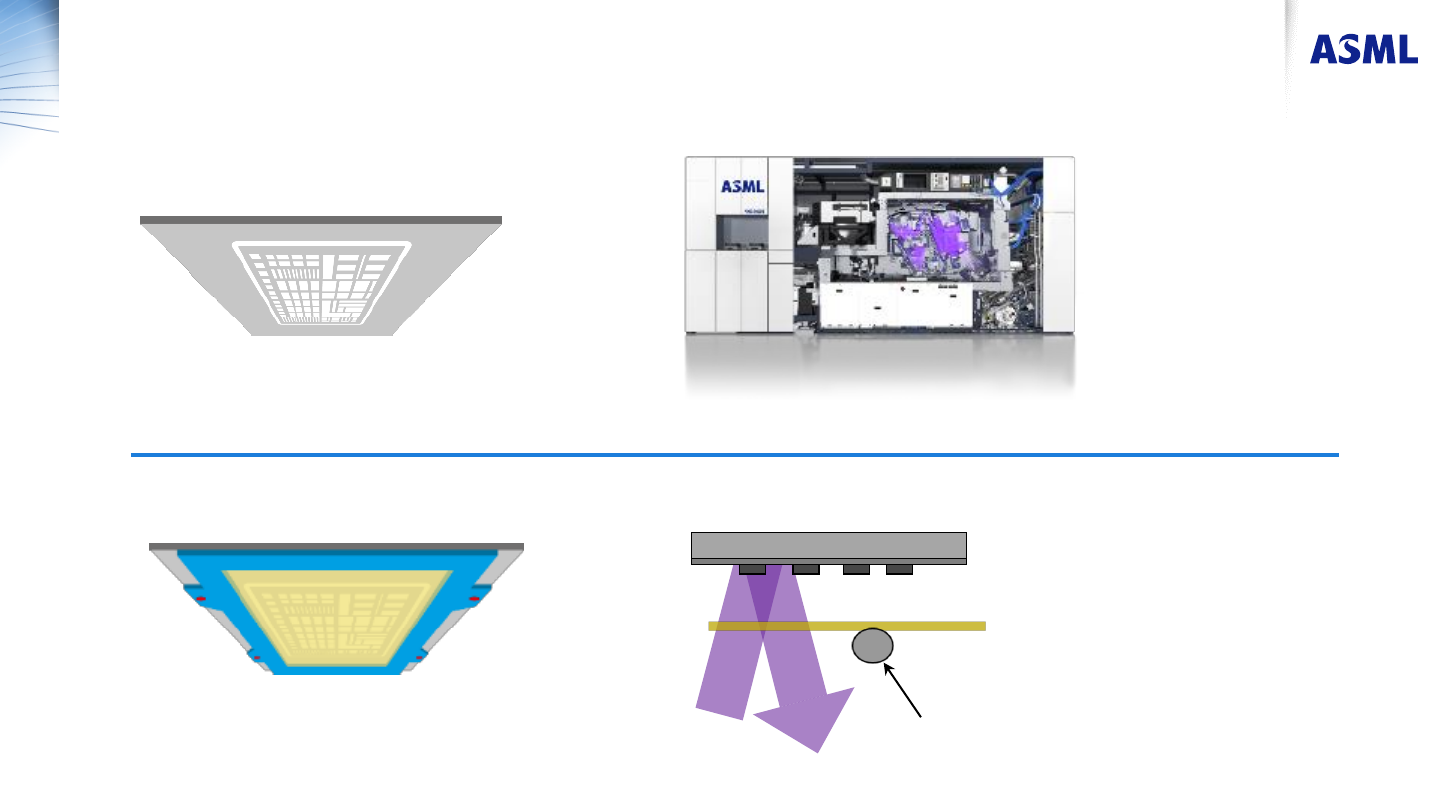
EUV Reticle frontside protection options
Public
Reticle
Reflected
illumination
EUV Reticle (13.5nm)
Reticle
particle
pellicle
Reticle with pellicle
Clean system
(without pellicle)
Slide 14
0
20
40
60
80
100
120
Aug-16 Nov-16 Mar-17 Jun-17 Sep-17 Dec-17 Apr-18 Jul-18 Oct-18 Feb-19
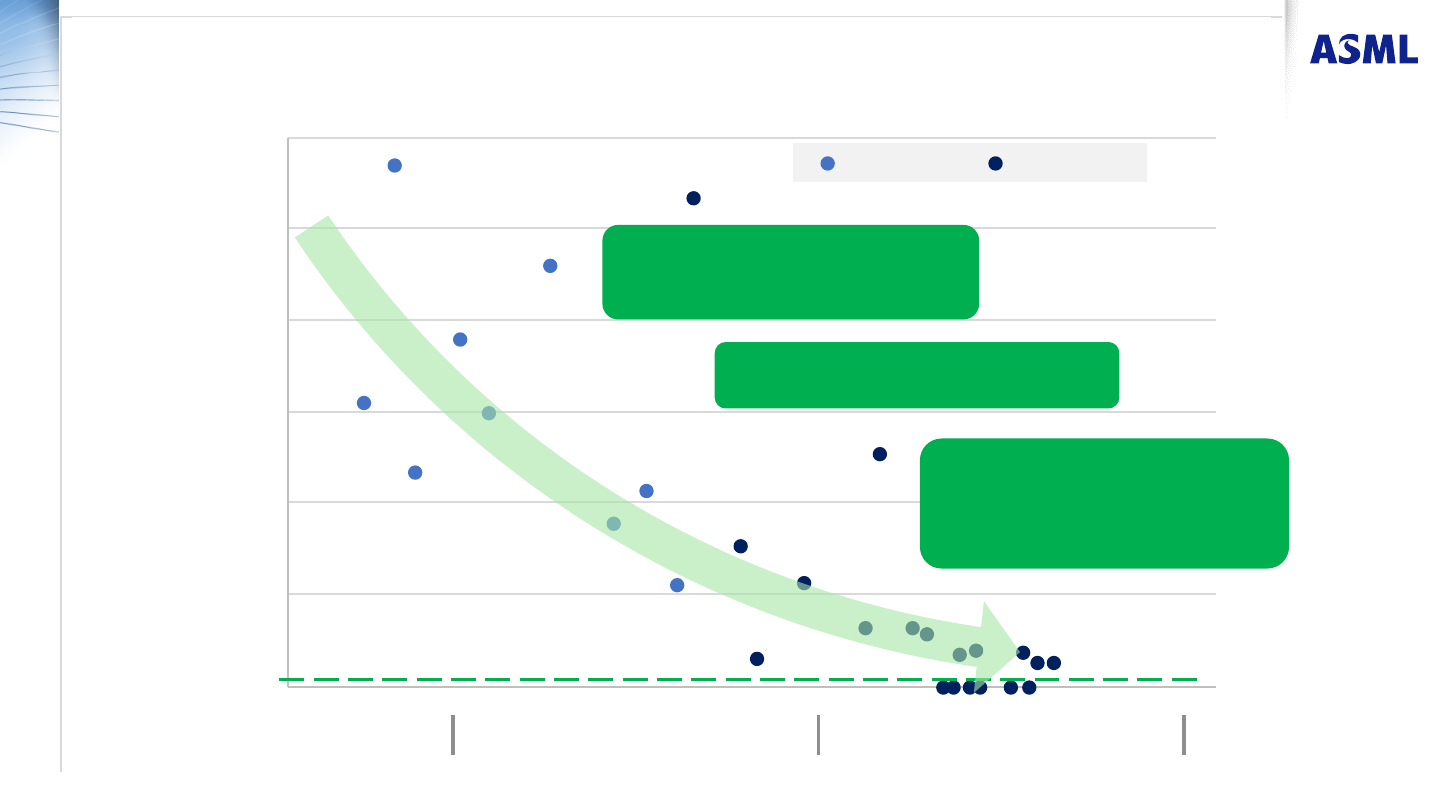
Particles added to reticle front
-side
per 10,000 wafer exposures
Reticle front-side adder performance
NXE:3350B NXE:3400B
Each data point represents between 1,000 and 10,000 wafer exposures in ASML factory or at a customer
HVM target
<1/10k
Improvements on hydrogen gas
curtain, parts cleanliness, in-situ
cleaning, factory way-of-working.
Continuous fine-tuning and
reduction of electrostatic effects
Improvement roadmap in place
to consistently meet HVM target.
Addressing particle generation,
release, and transport.
2016 20182017
Reticle front-side defectivity ~1/10k
Clean Scanner
Public
Slide 15
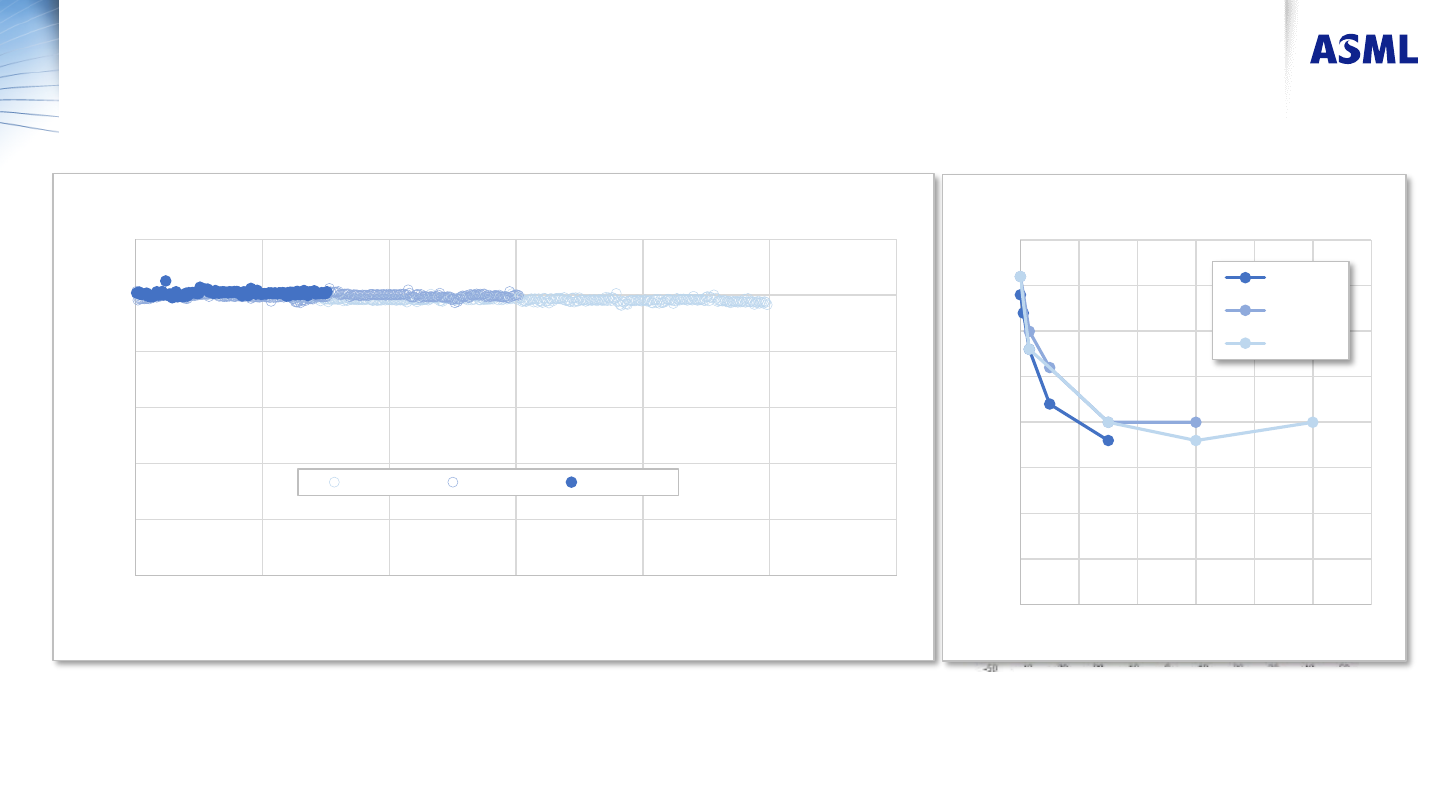
Pellicles robust to at least 10k wafers at 250W
No measurable degradation after 3k
Public
NXE:3400B @ 250W, 96 fields per wafer, 50mJ/cm2 sensor based, 35mJ/cm2 in resist
Pellicle #1 0-3k wafers, Pellicle #2 0-6k wafers, Pellicle #3 0-10k wafers, all latest version Mk2.2.
– 0.5%
– 0.6%
– 0.5%
0.0%
+0.3%
unexposed
300 wafers
3000 wafers
6000 wafers
10000 wafers
Pellicle #3 pre/post EUVT
delta at 300, 3k, 6k and 10k wafers
0
50
100
150
200
250
300
0 2000 4000 6000 8000 10000 12000
Source Power [W]
Wafers exposed
Mk2.2 pellicles exposed for up to 10k wafers at 250W
Pellicle #3 Pellicle #2 Pellicle #1
-1.5
-1.25
-1
-0.75
-0.5
-0.25
0
0.25
0.5
0 2000 4000 6000 8000 10000 12000
Chnage in EUVT [%]
Wafers exposed [#]
Mk2.2 degradation at 250W
Pellicle #1
Pellicle #2
Pellicle #3